
The Case for Pay-for-Value in Federal Homelessness Funding



Executive Summary
Advocates argue that ending homelessness requires more federal funding, citing rising rents and a workforce they characterize as “woefully underpaid.”1 The National Alliance to End Homelessness’s 2023 report “New Estimates Suggest that $4.8 Billion Is Needed to Bring Homeless Services Salaries into the Modern Era” advocated for an additional $9.6 billion in federal appropriations supporting the Continuum of Care Program, including $4.8 billion specifically to raise homeless service worker salaries.2
An examination of a balanced panel of 1,458 nonprofit Continuum of Care (CoC) providers shows that program budgets for compensation have increased significantly. Reported financials in both 2013 and 2024 show total compensation grew 117.8 percent and total revenue grew 123.9 percent, dramatically outpacing the 34.7 percent cumulative inflation rate and the 30.7 percent growth in the national Point-in-Time (PIT) homelessness count.3
Growth in the homelessness sector was not concentrated in a few outliers: 84 percent of providers grew compensation faster than inflation, 54 percent more than doubled it, and 29 percent more than tripled it.4 Provider compensation also grew roughly 2.7 times faster than the broader nonprofit sector benchmark on an annualized basis.5 The problem is not how money flows into the CoC system, as the National Alliance to End Homelessness’s report suggests. The problem is that the system pays for inputs (beds, salaries, services delivered) rather than for outcomes (people exiting homelessness for unsubsidized housing, employment, and treatment success). Compensation tracks revenue at a stable 36–39 percent of total income across the period, meaning the entire industry has grown together while measured outcomes have not moved.6

These findings support a federal course correction, which is already underway. The U.S. Department of Housing and Urban Development’s (HUD) FY 2026 Continuum of Care Competition Notice of Funding Opportunity (NOFO), released in 2026, operationalizes Executive Order 143217 by declaring that “Housing First has been a profound failure,” making 40 percent of renewal funding fully competitive based on merit between communities, setting aside $1.3 billion for transitional housing and supportive services, and scoring providers on reductions in unsheltered homelessness, treatment, employment income, and exits to unsubsidized housing rather than the number of beds funded. This report supplies the empirical case for that reorientation, drawn from the providers’ own IRS Form 990 filings.
The data clearly shows that the solution is not more dollars spent, but rather a programmatic change that prioritizes incentives. The FY 2026 NOFO’s pivot to scoring outcomes, competing renewals, and rebalancing toward services is the right method for rewarding value and performance in homelessness assistance.
The Advocates’ Case for More Money
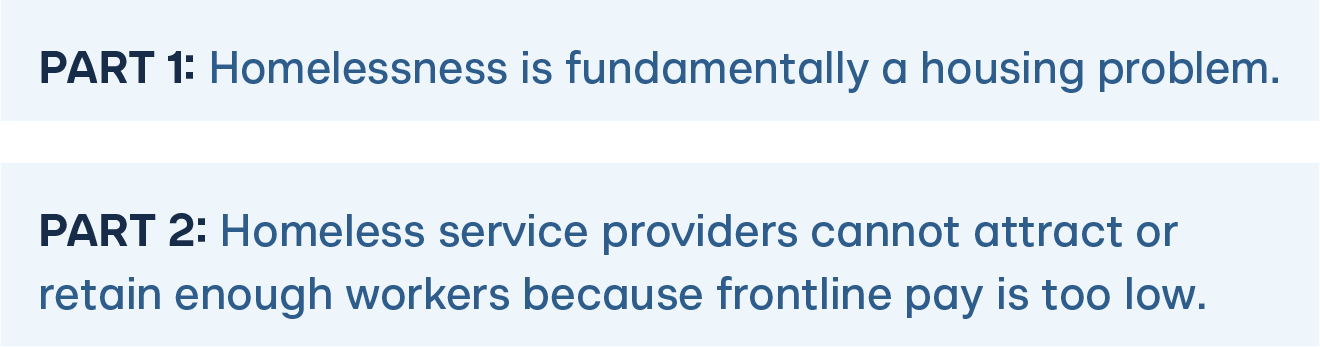
The dominant advocacy argument for more federal homelessness funding has two parts: First, that homelessness is fundamentally a housing problem driven by rising rents, requiring more housing subsidies to keep people stably housed.8 And second, that homeless service providers cannot attract or retain enough workers because frontline pay is too low, and that the federal government should add roughly $4.8 billion to existing CoC funding to bring those salaries to a livable level.9
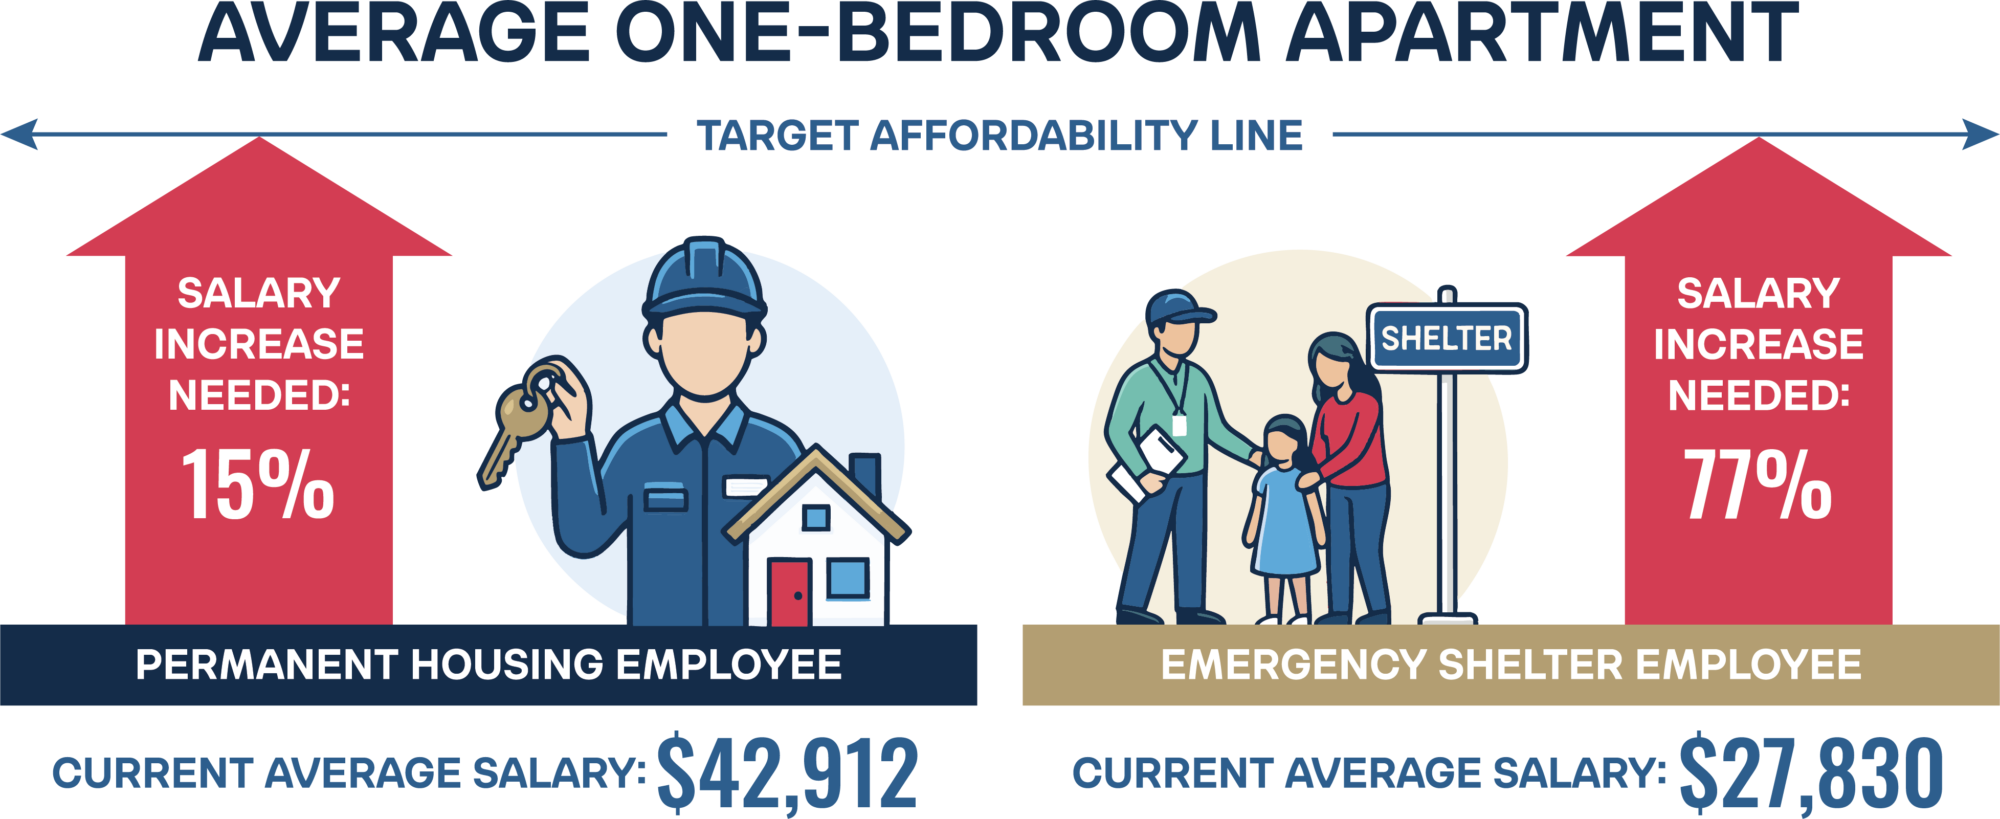
The National Alliance to End Homelessness, the field’s most prominent advocacy organization, has built its policy ask around this workforce argument.10 It estimates that the average permanent housing employee earns $42,912 and the average emergency shelter employee earns $27,830, and argues that these workers would need salary increases of 15 percent and 77 percent, respectively, to afford the average one-bedroom apartment in their region.11 The frontline-pay point is empirically supportable in that many direct-service positions in shelter and outreach work do pay below the cost of living in high-rent metros.12 But the policy conclusion that the field draws (that the system should receive several billion dollars in additional funding without changing how those dollars are awarded or measured) does not follow from the frontline-pay data once total industry spending is examined.
What the Industry-Wide Data Actually Shows
Universe and Method
This report analyzes every organization that received a HUD Continuum of Care Program award in fiscal year 2024 (6,533 project-level award lines, representing 1,825 unique nonprofit recipients after governmental entities are excluded and recipients are matched to unique IRS Employer Identification Numbers (EINs) in ProPublica’s Nonprofit Explorer).13 For the trend analysis, the report uses a balanced panel of 1,458 nonprofit providers that filed IRS Forms 990 reporting positive salary values in both 2013 (the year Housing First became the dominant federal funding orientation) and 2024 (the most recent fiscal year).14 Holding the panel constant removes the distortion that would come from new entrants or providers that ceased operations. Figures for 2013 through 2023 were pulled programmatically from the ProPublica Nonprofit Explorer machine-readable API, and fiscal year 2024 figures, which ProPublica publishes on each organization’s page ahead of its API, were taken and independently verified prior to publishing.
Compensation and Revenue Both More Than Doubled
Across the balanced panel, total compensation (officer compensation plus other salaries and wages, IRS Form 990 Part IX lines 5 and 7) grew from $6.53 billion in 2013 to $14.22 billion in 2024, a 117.8 percent cumulative increase.15 Total revenue grew from $16.51 billion to $36.98 billion over the same period, a 123.9 percent increase.16 By comparison, cumulative consumer price inflation over the 2013–2024 period was 34.7 percent.17 The national Point-in-Time homelessness count, the system’s outcome metric of record, grew from 590,364 in 2013 to a record 771,480 in 2024, an increase of 30.7 percent.18 HUD CoC Program awards (the federal money this industry receives) grew from $2.17 billion in FY 2018 to $3.62 billion in FY 2024, a 67.3 percent increase in just six years.19
Figure 1. Industry-Wide CoC Provider Trends: Compensation, Revenue, Federal Funding, Homelessness, and Inflation, 2013-2024 (Balanced Panel of 1,458 Providers)
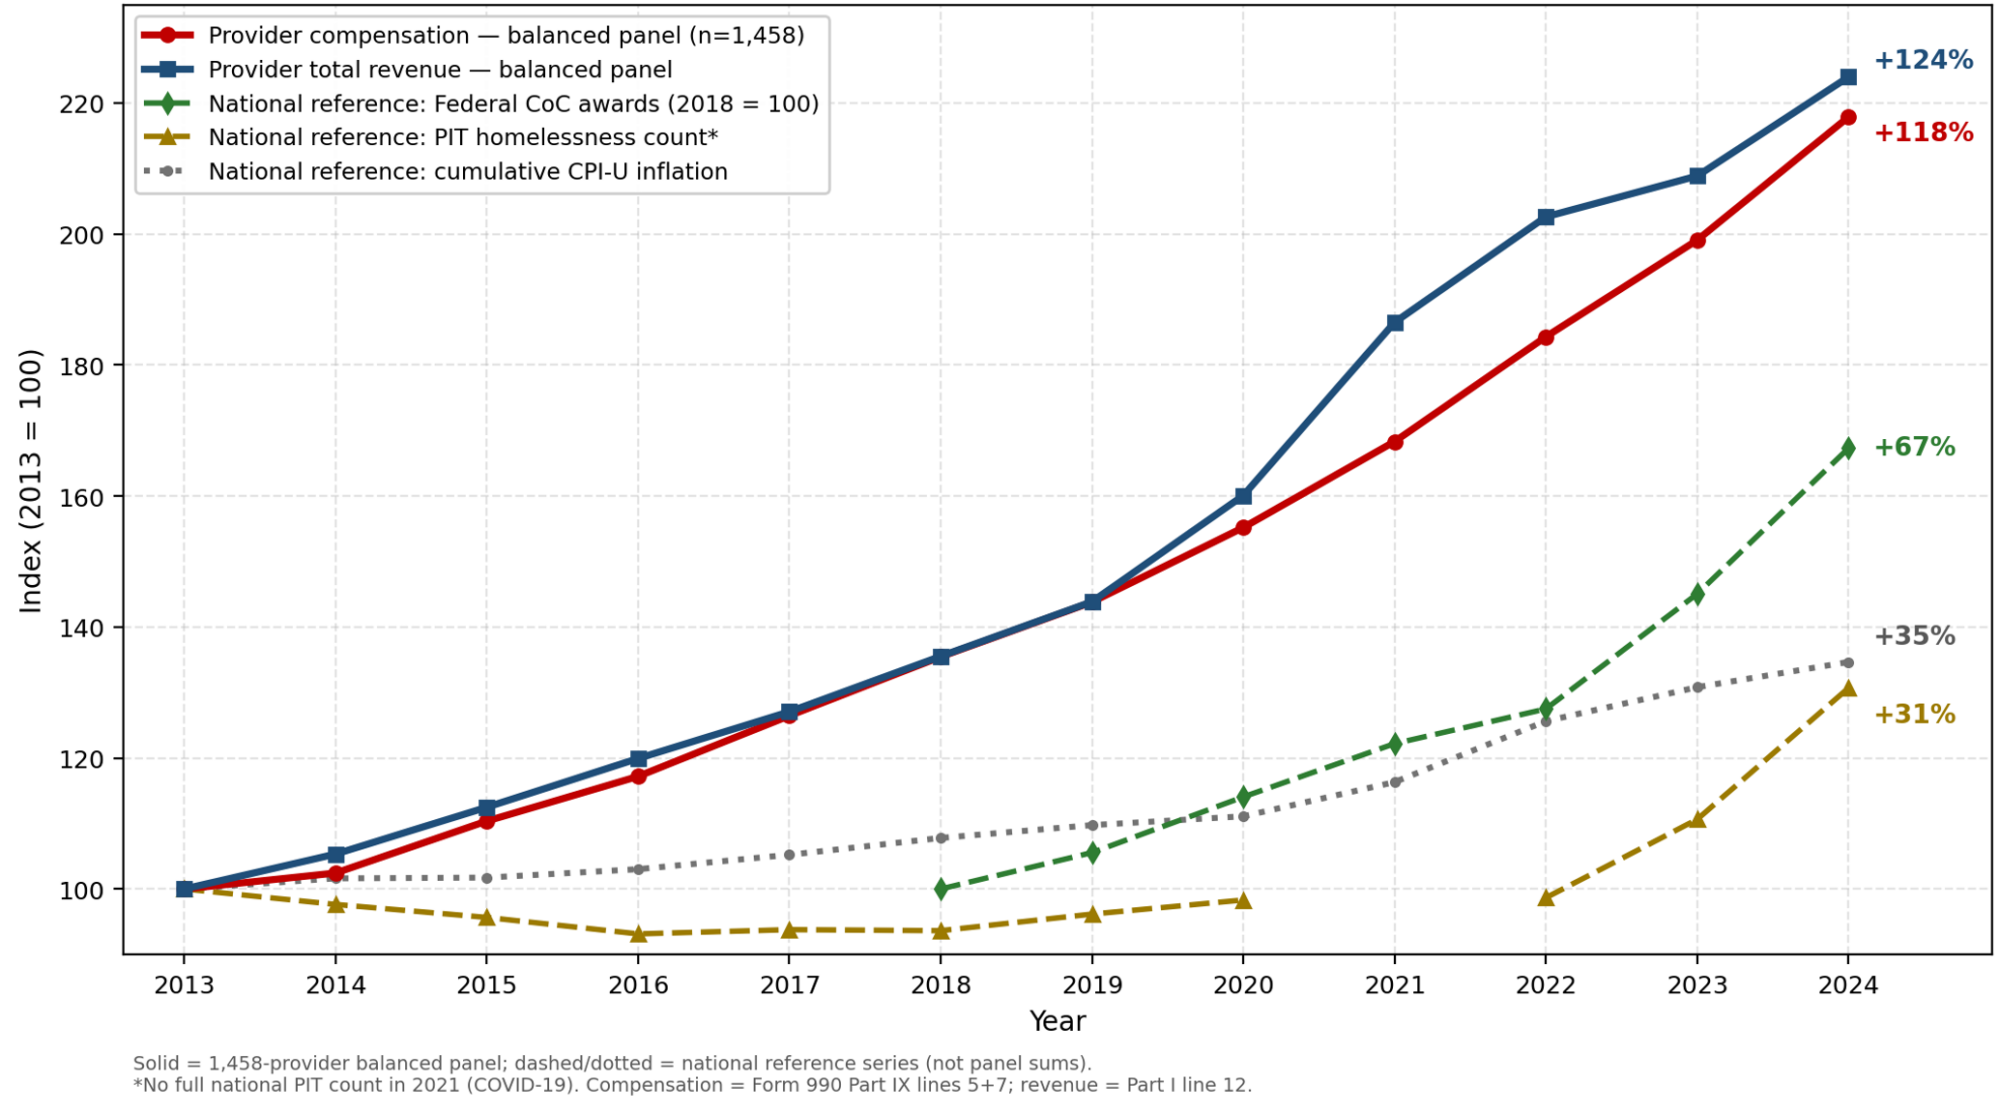
Figure 1. Industry-wide CoC provider trends, 2013–2024, indexed to 2013 = 100. The solid lines (compensation and revenue) are the 1,458-provider balanced panel; the dashed and dotted lines (federal CoC awards, the national Point-in-Time count, and CPI-U inflation) are national reference series shown for comparison, not panel sums. Compensation and revenue grew roughly three times as fast as inflation and the homelessness count. Sources: author analysis of ProPublica Form 990 data (2013–2023 via the machine-readable API; FY2024 from verified ProPublica page extracts); HUD CoC Program award tables; HUD AHAR Part 1; BLS CPI-U.
The story holds at the individual-provider level. Among the 1,458 panel providers, the median compensation growth from 2013 to 2024 was 113.3 percent, the mean was 318.3 percent, and 83.7 percent grew faster than inflation; 54.0 percent more than doubled; 29.1 percent more than tripled.20
The broader nonprofit sector benchmark is much lower. Candid’s 2024 Nonprofit Compensation Report, drawing on 209,655 observations from 128,238 tax-exempt organizations, found that median nonprofit CEO compensation grew from $118,541 in 2018 to $132,077 in 2022, an 11.4 percent increase over four years.21 On an annualized basis (7.3 percent per year for the CoC panel versus 2.7 percent for the Candid benchmark), the CoC provider sector grew compensation roughly 2.7 times faster than the broader nonprofit benchmark.
Compensation Tracks Revenue: The Whole Industry Grew, Not Just Executives
Figure 2. Compensation Tracks Revenue: Sector Compensation Held Steady Near 36-40% of Total Revenue, 2013-2024 (Balanced Panel of 1,458 Providers)
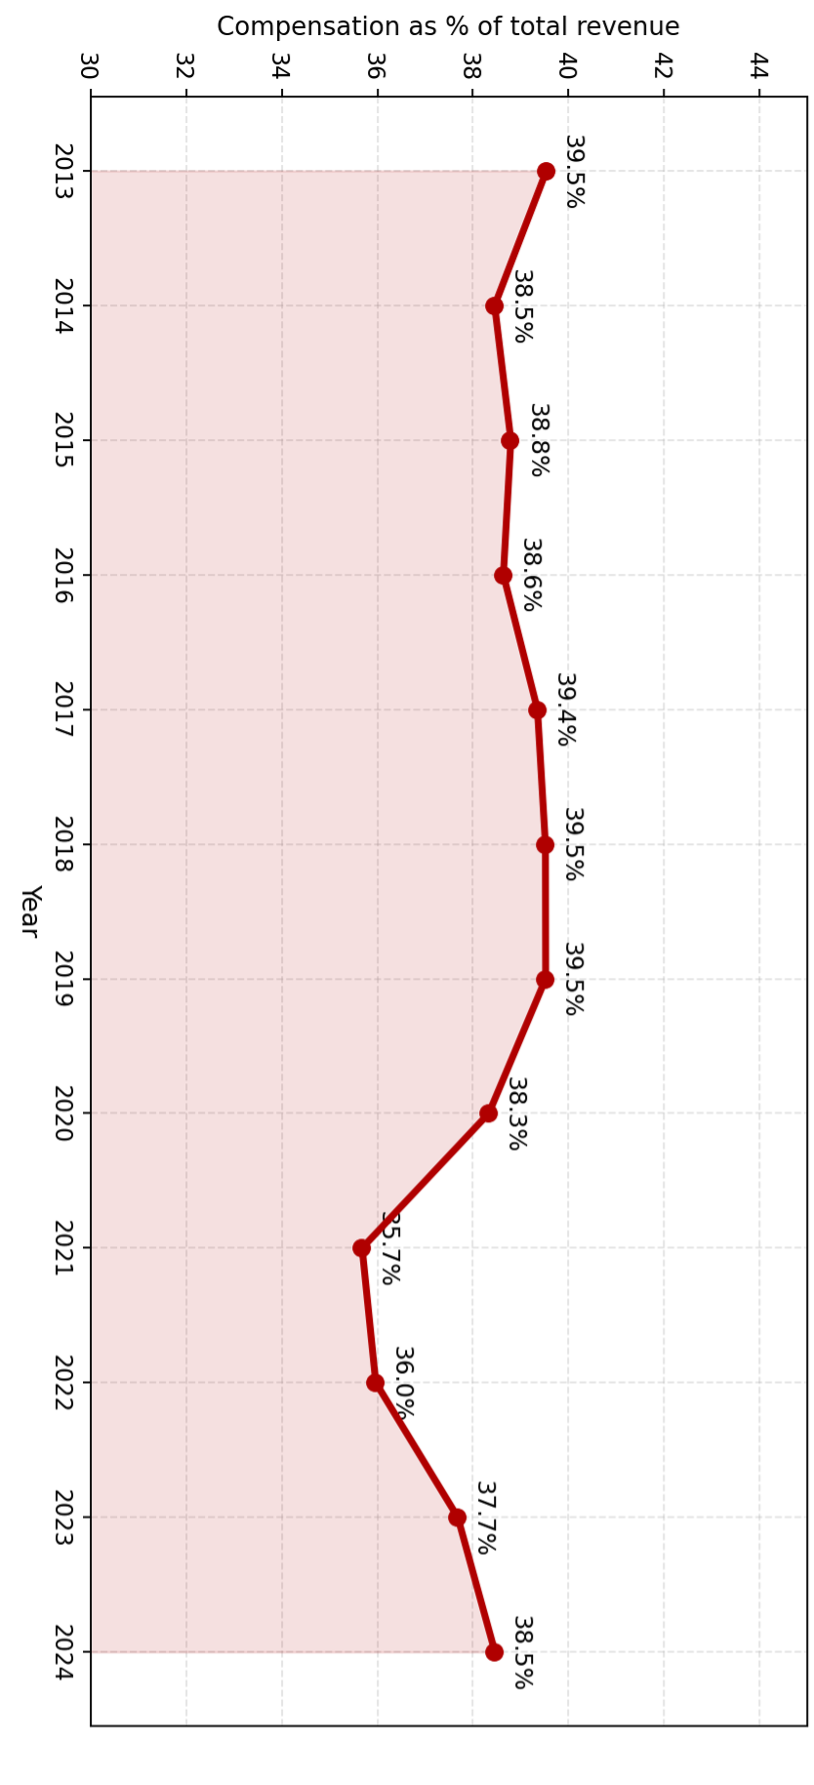
Figure 2. Total compensation as a share of total revenue across the balanced panel, 2013–2024.
The ratio stays within a narrow 36–39 percent band, indicating that growth in salaries tracks
growth in total revenue rather than reflecting disproportionate executive enrichment alone.
One important nuance: total compensation as a share of total revenue remained essentially stable across the period, ranging from a low of 35.7 percent in 2021 to a high of 39.5 percent, ending at 38.5 percent in 2024.22 This shows that the entire industry (executive compensation, staff salaries, and total revenue) has grown together roughly in proportion. The implication of this analysis shows that an additional $4.8 billion would, under current rules, predictably flow through the same input-based award process and produce similar growth across the same compensation categories without any guarantee of improved outcomes (when considering PIT count growth, there may be reason to suspect an inverse relationship; see “Compensation and Revenue Both More Than Doubled”).23
Methodology
The study begins with all nonprofit direct recipients listed in HUD’s FY 2024 CoC award tables that could be matched to a unique EIN, rather than a sample drawn from those records.24 The 6,533 award lines consolidate to 1,825 nonprofit legal entities. Governmental grantees are excluded because they do not file Form 990. The resulting universe should not be described as every organization performing CoCfunded work: unnamed subrecipients, subcontractors, and governmental providers are outside the data.25
Utilizing publicly available ProPublica data for the 2013–2024 trend, the panel is restricted to 1,458 recipients with positive salary values at both endpoints, so growth is measured over the same legal entities.26 Compensation is Form 990 Part IX, lines 5 and 7 (current-officer compensation plus other salaries and wages); revenue is Form 990 Part I, line 12. The measure is organization-wide and is not a payroll roster, a headcount measure, or a measure of frontline-worker pay.27
Executive Compensation Snapshot
Fiscal year 2024 officer-compensation tables were available on ProPublica for 1,698 nonprofit CoC providers as of May 2026; 1,525 of them reported at least one paid officer.28 Among those, the total compensation of each nonprofit’s top-paid official averaged $209,583; the median was $161,123; the 75th percentile was $245,991; the 90th percentile was $352,962.29 These figures should be benchmarked against budget and complexity, but even before any benchmarking, the data refutes the framing of the field as one in which money does not reach the workforce. The aggregate $14.22 billion in 2024 panel compensation is roughly equal to four years of HUD CoC awards at current levels.30
State-Level Growth Is Broad and Consistent
Figure 3. Cumulative Compensation Growth at HUD-Funded CoC Providers by State, 2013-2024. Balanced panel: 1,458 nonprofit providers; cumulative CPI-U inflation 2013-2024 was 34.7%. Interpret small panels (n<5) with caution.
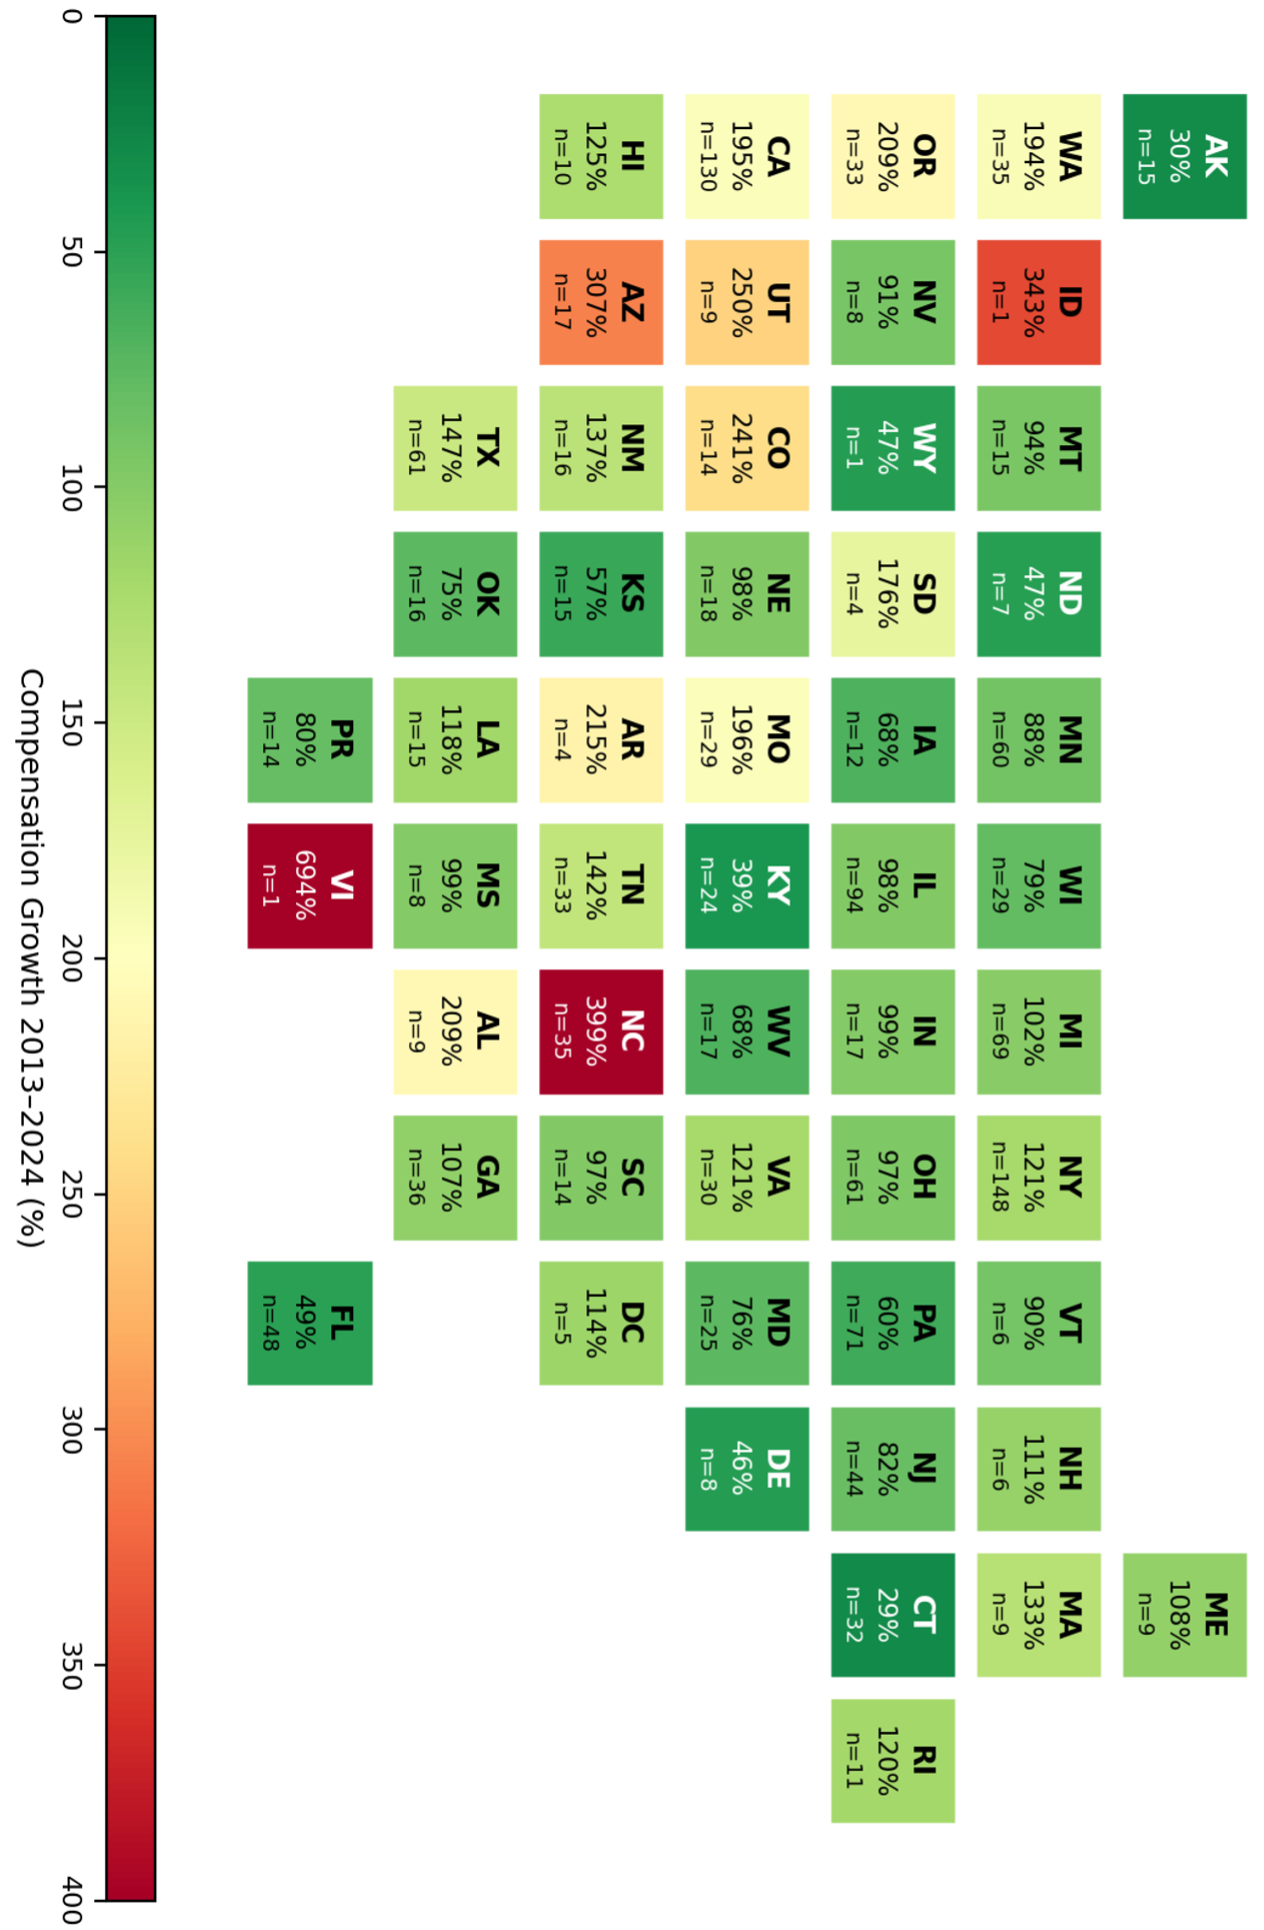
Figure 3. State-by-state cumulative compensation growth among HUD-funded CoC providers, 2013–2024.
Fifty-one of the 53 jurisdictions exceeded the cumulative inflation rate of 34.7 percent. Sample sizes (n)
are shown in each tile; states with small panels (n<5) should be interpreted with caution.
The compensation growth pattern is national. Fifty-one of the 53 jurisdictions with balanced-panel data exceeded the 34.7 percent inflation benchmark, and 27 of them more than doubled compensation between 2013 and 2024. Growth rates were highest in North Carolina (+399 percent across 35 providers), Arizona (+307 percent across 17 providers), Utah (+250 percent across nine providers), and Colorado (+241 percent across 14 providers). Even the two states with the lowest growth, Connecticut (+29 percent) and Alaska (+30 percent), landed within six percentage points of the inflation benchmark. Only those two of the 53 jurisdictions show compensation growing more slowly than inflation, and neither by more than six percentage points.
Figure 4. Change in unsheltered homelessness by state, 2013-2024
HUD PIT counts; 50 states + D.C.: 191,434 to 271,350 (+41.7%)
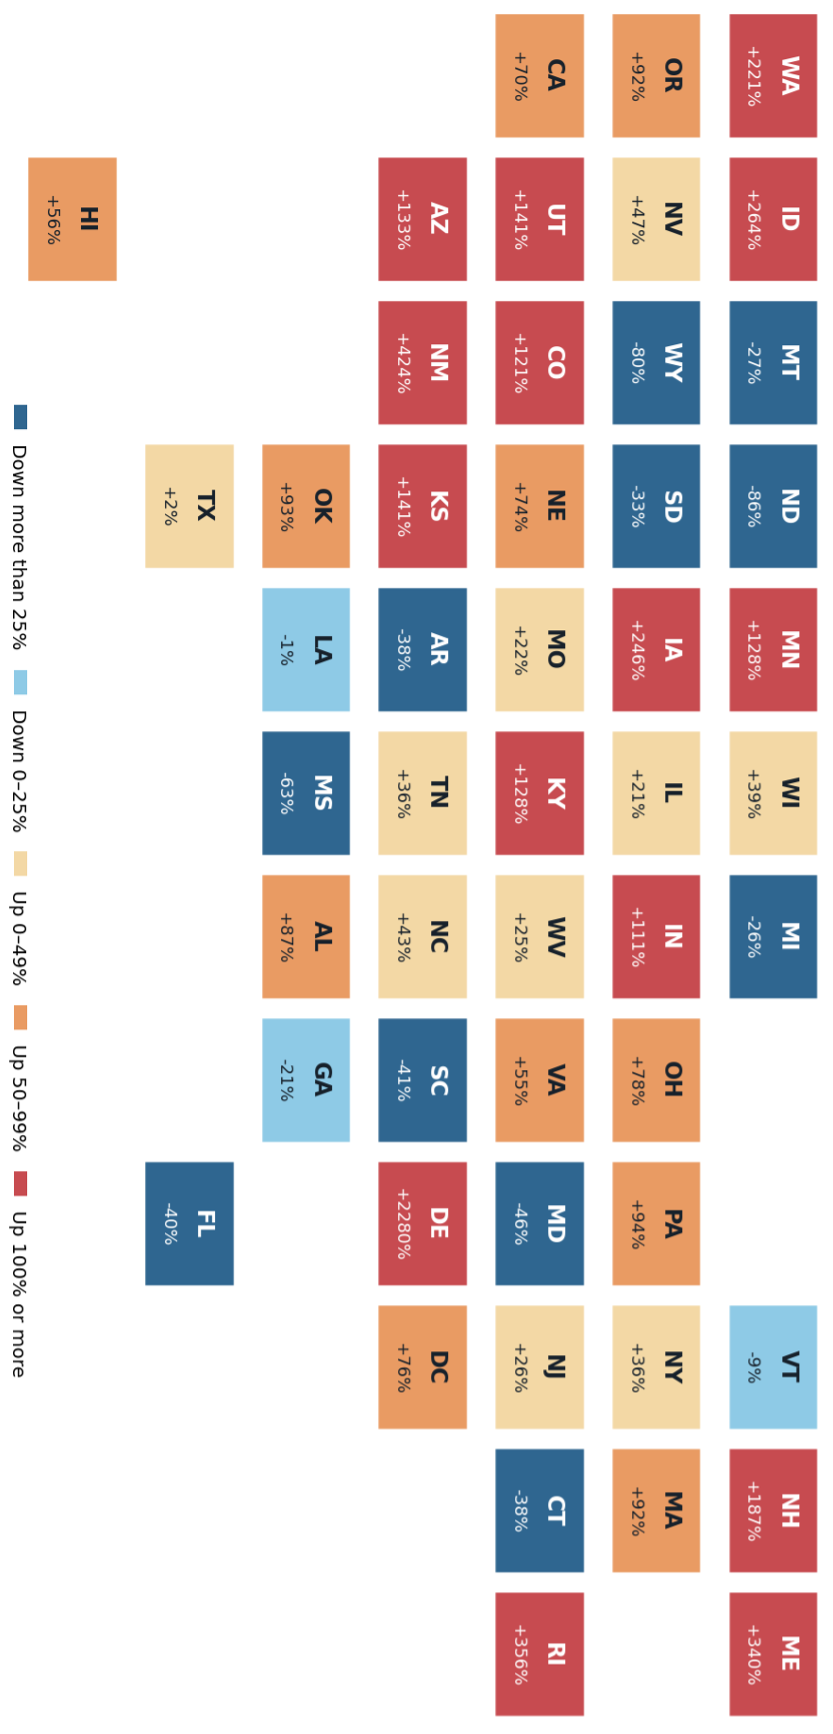
Figure 4. State-by-state change in unsheltered homelessness, 2013–2024. Fifty states and the District of Columbia are shown; Puerto Rico and U.S. territories are excluded. Values are one-night PIT estimates and may be affected by changes in local counting methods.
Source: HUD state Homeless Populations and Subpopulations reports, 2013 and 2024.
Figure 4 provides a state outcome comparison, but it should not be correlated mechanically with Figure 3. PIT counts assign people to the place where they were counted; provider compensation is assigned by recipient location and may include multi-state, multi-program activity. The two state series therefore use different units of analysis and do not support a state-level causal inference.
Why the Current Funding Model Has Not Reduced Homelessness
The System Pays for Inputs, Not Outcomes
The HUD CoC Program is structured as an annual reimbursement and renewal grant.31 Funded projects receive money based on the activities they propose to deliver (units of permanent supportive housing, hours of supportive services, beds of transitional housing) and continue to receive renewal funding year over year so long as they execute those activities and meet basic compliance thresholds.32 Until very recently, system-performance metrics carried limited weight in the renewal decision.33 CoCs measured exits to permanent housing, returns to homelessness, and reductions in episode length, but funding allocations were not strongly conditioned on those measures, and chronically underperforming projects were rarely reallocated.34 The system historically paid providers for activities and outputs (beds occupied, services delivered) rather than for outcomes (people stably housed and employed), a practice this paper will refer to as “fee-for-service contracting.”35
HUD’s policy of calculating annual renewal demand also contributes to rising reimbursements. Annual renewal demand is required for CoCs to determine how much in federal funding is required to maintain rental subsidies for the entirety of a CoC’s housed participants. As a part of their application for federal funding, each CoC must calculate the amount of money required to maintain housing for all of its participants. This does two things: first, it creates an ever-upward ratcheting of costs to maintain housing for program participants. It essentially creates a policy where CoCs get to write in the amount of funding they want to receive and sends the check to HUD for signature.36 Second, it creates a disincentive to put downward pressure on rents, resulting from the knowledge that higher rents create higher revenue in the form of federal awards for the CoC.
Incentives Explain the Outcome
Fee-for-service contracting produces predictable incentive effects.37 Providers expand activities to meet the funding provided by the system because that is what generates revenue. They do not have a corresponding financial reason to reduce the population they serve, because shrinking caseloads under fee-for-service shrinks revenue. As an example, the national homeless services inventory now reports more total year-round beds than the official PIT count of homeless persons, yet unsheltered homelessness has hit record highs.38 CoC compensation has more than doubled while the population the system exists to serve has kept growing, reaching a record 771,480 in 2024.39 These outcomes are not caused by bad actors alone; they are also shaped by the incentive structure of the funding model itself. A pay-for-value model, by contrast, would pay more to providers that move more people out of homelessness into stable, unsubsidized housing and employment, and pay less to providers that do not.40
The “More Money” Argument Fails on Its Own Terms
The National Alliance to End Homelessness argues that frontline employees are underpaid relative to local rents.41 The same period in which that claim was developed saw industry-wide compensation grow at more than three times the rate of inflation and at roughly 2.7 times the rate of the broader nonprofit sector.42 If frontline workers are still underpaid after compensation has doubled, the binding constraint is the allocation of dollars inside provider organizations, not the absolute volume of federal funding. Adding $4.8 billion to the existing system on the existing terms would predictably reproduce the same distribution.43
The Federal Shift Toward Pay-for-Value
Executive Order 14321
On July 24, 2025, President Donald J. Trump signed Executive Order 14321, “Ending Crime and Disorder on America’s Streets,” published in the Federal Register on July 29, 2025.44 The order finds that “the Federal Government and the States have spent tens of billions of dollars on failed programs that address homelessness but not its root causes,” and directs federal agencies to “prioritize grants for States and municipalities” that enforce prohibitions on open drug use and urban camping and that redirect funding toward treatment, civil commitment, and recovery.45 The order directs HUD and other agencies to use their existing discretionary grant authority to align funding conditions with the new policy.46
The FY 2026 NOFO Operationalized the Shift
HUD released the FY 2026 Continuum of Care Competition NOFO in 2026, with applications due August 26, 2026 and awards anticipated by December 1, 2026; approximately $4.04 billion is available.47 HUD states that “Housing First has been a profound failure by any measure,” observing that since 2013 literal homelessness has risen 27 percent, chronic homelessness 80.5 percent, and unsheltered homelessness 36.1 percent, even as taxpayer-funded permanent-housing beds increased 150.9 percent and “CoC spending has increased 111 percent.”48 That spending figure is, within rounding, the same industry-wide growth this report documents from the providers’ own 990 filings. The NOFO commits HUD to “supporting meaningful, sustained reductions in homelessness and increases in self-sufficiency rather than measuring outputs such as the number of beds created or filled.” It directs CoCs to prioritize projects that increase employment income over government assistance, noting that as of 2023 a median of only six percent of people in CoC-funded housing increased their earned employment income while 33 percent increased their benefits and welfare income.49
In FY 2024, HUD notes, roughly 90 percent of each CoC’s Annual Renewal Demand was awarded “without any connection to CoC score or project merit,” so only about 10 percent of awards were genuinely competitive. For FY 2026, HUD sets Tier 1—the protected, noncompeted floor—at 60 percent of Annual Renewal Demand and competes the remaining 40 percent on merit between geographic areas, declaring the CoC Program “a competitive program, not an entitlement program or block grant.” It also carves out a $1.3 billion set-aside for new projects prioritizing Transitional Housing and Supportive Services Only, the components HUD says had collapsed to one percent of awards while Permanent Housing absorbed 88 percent.50 Taken together, the FY 2026 NOFO is the most outcome-and competition-oriented CoC competition in the program’s history.
Conclusion
The advocacy case for increased federal support rests on the premise that frontline workers are underpaid and that additional funding will attract and retain the people the system needs.51 The first half of that claim is partially correct; the second half is contradicted by the industry’s own 990 filings. Industry-wide compensation has more than doubled since 2013, total revenue has more than doubled, and federal grant funding is at its highest level ever.52 Over the same period, the population the system exists to serve has grown by 31 percent and unsheltered homelessness has reached record levels.53
Executive Order 1432154 and HUD’s FY 2026 NOFO have moved the CoC Program decisively from a fee-for-service input model toward a pay-for-value outcome model, restructuring the competition, setting aside $1.3 billion for transitional housing and services, and weighting scores toward employment, treatment, and reductions in unsheltered homelessness. Moving from a fee-for-service model to a pay-for value model will present challenges, but doing so is critical to serving the most pressing needs of this vulnerable population.

Stay Informed
Sign up to receive updates about our fight for policies at the state level that restore liberty through transparency and accountability in American governance.