
What Does the Point-in-Time Count Measure?

Every year, in the early mornings of January, volunteers descend on the streets and alleys of America to count the number of people who are homeless. The resulting numbers are published as the Point-in-Time Count, a federally required census of people living on the street, in transitional housing, and in emergency shelters. According to the National Alliance to End Homelessness, the count helps policymakers and programs track progress, attract resources, plan services, and meet local needs.1
The results of the Point-in-Time Count are tabulated, verified, and sent to the U.S. Department of Housing and Urban Development where the data is reported to Congress in the Annual Homelessness Assessment Report (AHAR). The Point-in-Time Count is the most reliable estimate of homelessness and serves as the benchmark to determine if progress is being made.
The count has been occurring since 2005, which provides a rich set of historical data to determine how well homelessness assistance interventions reduce homelessness. Comparing the number of people estimated in the count with awards to communities to fund homelessness assistance programs and the number of housing units created to house people who are homeless provides important detail in determining the effectiveness of the federal program.
Since 2013, the federal homelessness program has prioritized the creation of permanent supportive housing (PSH) as the primary means to reduce homelessness. PSH is permanent in that it is secured by a lease between homeless people and homelessness housing providers. PSH is supportive in that it requires case management as a means of keeping formerly homeless tenants in their units. PSH is housing that is not time-limited or congregate, like a shelter.
It is often assumed that the estimate of homeless people equals the demand for permanent supportive housing. The supposition is that, if enough housing is provided to meet the Point-in-Time Count estimate, homelessness will end. That is one of the reasons that, in the last two decades, we have witnessed a significant push for the creation and subsidization of permanent housing for the homeless. It is unclear, however, if the number of unsheltered persons captured in the Point-in-Time Count expresses a need for more permanent housing.
Although the Point-in-Time count may be the most comprehensive dataset on the U.S. homelessness population, there are various threats to its reliability. Primarily, HUD guidelines change over time and Continuums of Care (CoCs), the local entities charged with implementing HUD’s homelessness programs, have local autonomy in how they conduct the annual counts. Not only does that create variance in the counts among localities, the localities themselves may change the ways in which they conduct the counts in different years, making the data very difficult to track. People living with friends and family, in hospitals or jails, and who are in permanent housing are excluded. There was also a significant definitional change in 2013 in who can be counted. Still, the categories for their tally are the same: unsheltered and sheltered, and, if sheltered, which program they are in (Safe Haven or Transitional Housing).i
In addition to counting people, HUD also requires CoCs to count beds and units. The annual Housing Inventory Count reports the inventory of beds as well as the percentage of those beds which are occupied.
While these counts have serious flaws and are known to underreport the number of homeless people, they are currently the best approximation of homelessness levels over time and nationally. Those who seek empirically guided policy have little choice but to reference them.ii
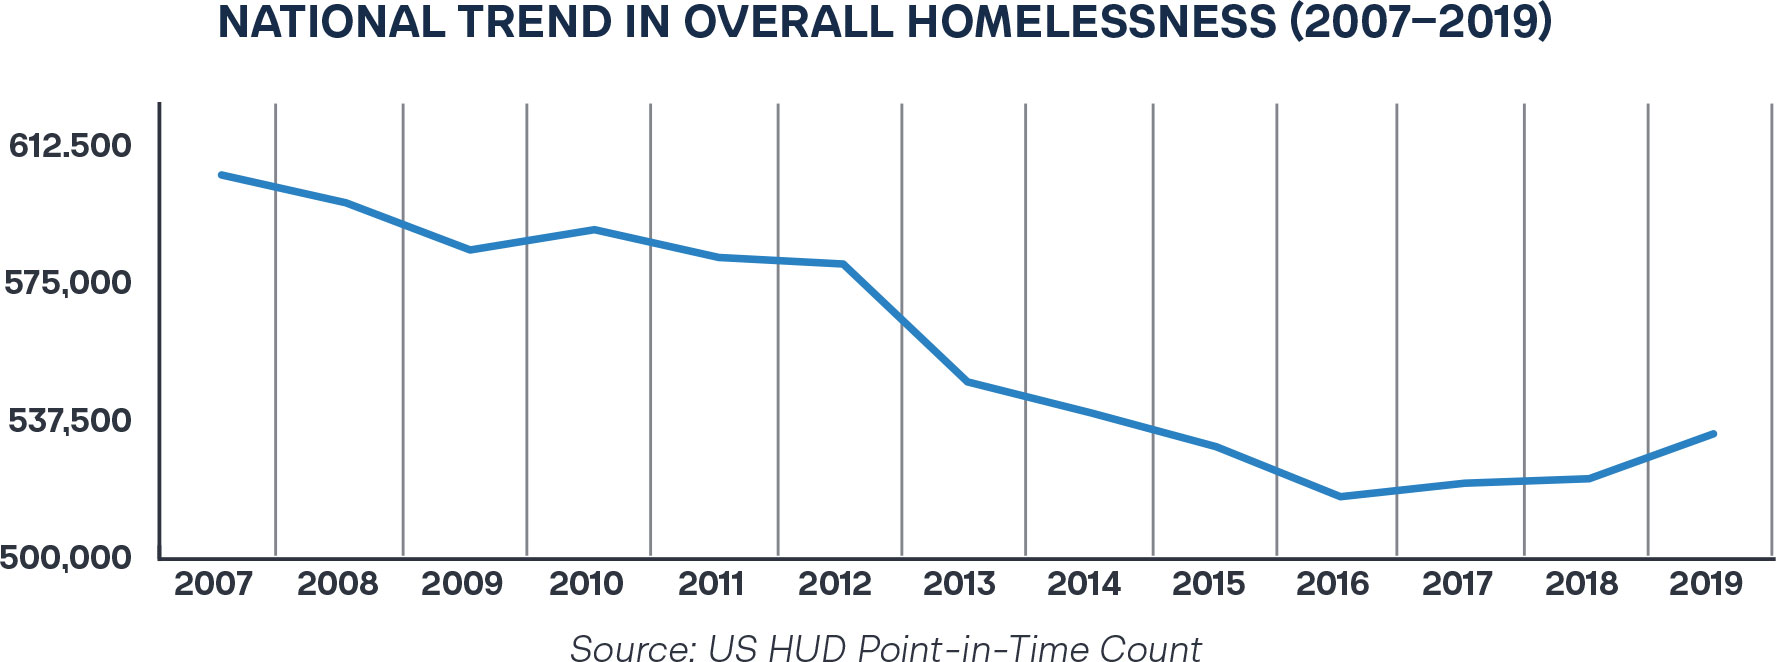
The annual estimate of people experiencing homelessness demonstrated a 3.4 percent drop in overall homelessness between 2007 and 2012 (before HUD changed the definition of homelessness). A slightly higher 4.6 percent decline occurred between 2013 and 2016 but then increased to 3.2 percent from 2016 to 2019. Since HUD incentivized the creation of permanent housing programs since 2005, advocates of the current policy point to these declines in the number of people estimated to be homeless as evidence of success.
This trend, depicted above, assumes that the number of homeless individuals declined because they are entering permanent supportive housing and, by definition, are no longer homeless. If so, the rise after 2016 could be due to a lack of supply of permanent supportive housing. In other words, the number of people living on the street were accepted and entered PSH as it was made available until no more units were available.
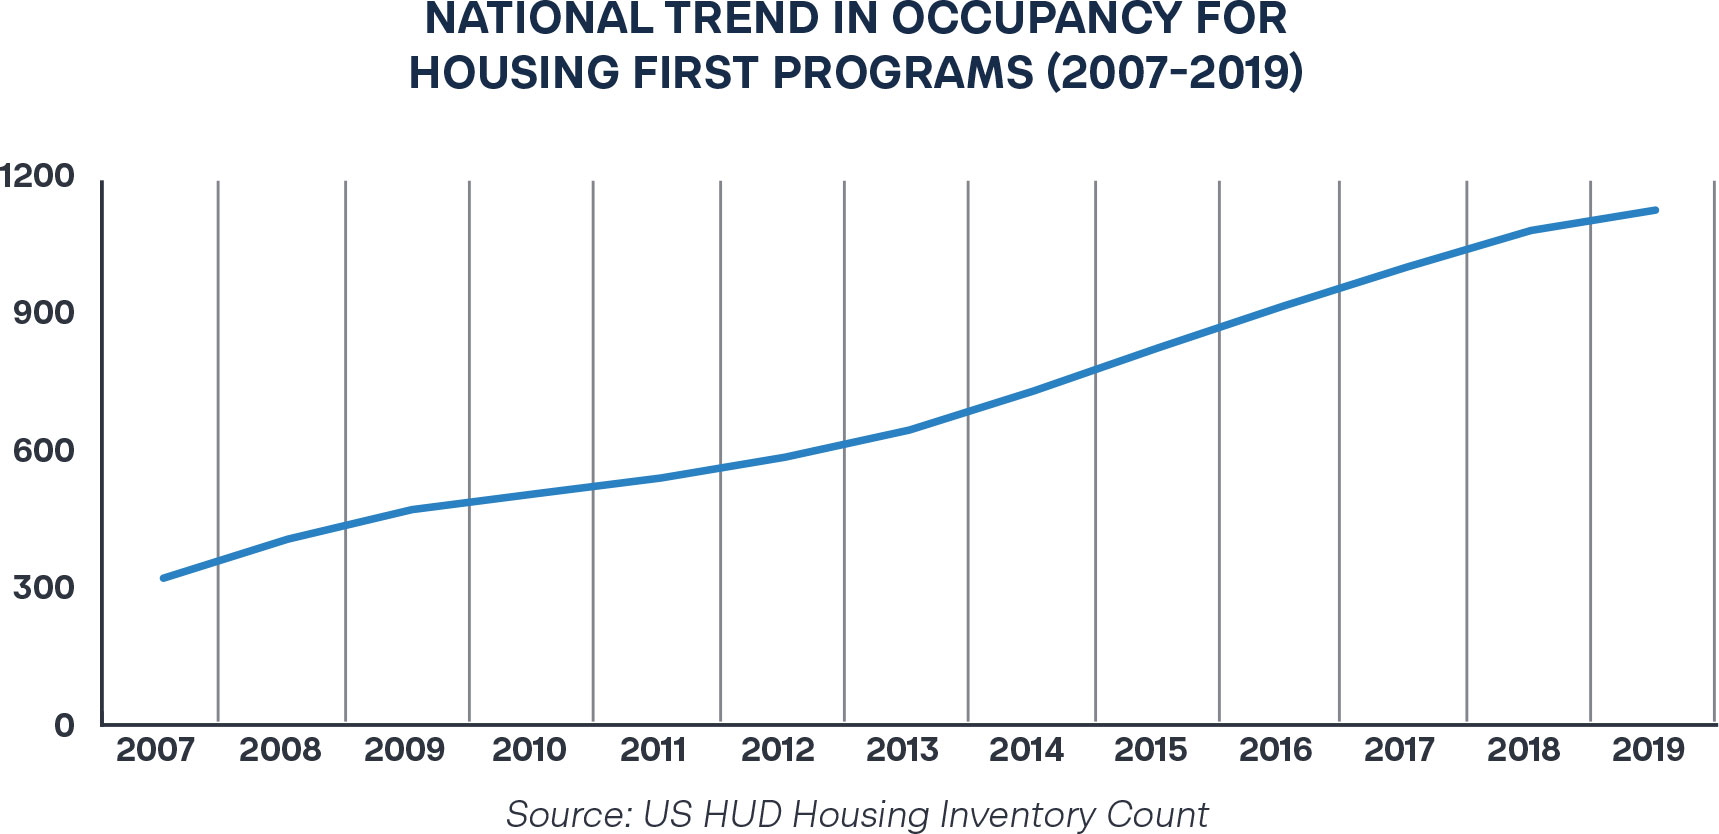
Nationally, however, the occupancy for PSH and Rapid Re-Housing (a time-limited version of PSH) units has remained below 83 percent of total capacity from 2007 to 2019, suggesting that housing was available to those that would want it. While this trend may reflect a lack in outreach and excludes seasonal trends of need,iii it seems unlikely that people will remain on the street because the availability of permanent housing units has ended or are delayed.iv
During this same period, cities were struggling with an increase in unsheltered homelessness and the ability to create PSH quickly. In fact, in 2018, the Ninth Circuit Court ruled in Martin v. Boise that a lack of shelter beds causes unsheltered homelessness2—emphasizing the supply and demand characterization of the Point-in-Time and Housing Inventory Counts. Such causal claims are hard to support. The chief concern with such a pronouncement is that it distorts the diverse needs of the homeless population by reducing those needs to a lack of housing. Rather than defend policies that promote the allocation of resources to match needs, such a claim results in a mandate for a “one-size-fits-all” approach. In other words, if it is assumed that homelessness is caused by a lack of housing, the solution is to provide housing at a rate that meets the demand—the number of people experiencing homelessness.
The common results of one-size-fits-all policies are wasted resources and unmet needs. This can be derived by examining the occupancy rates of federally subsidized homelessness housing. Housing Inventory County (HIC) data on the number of PSH beds and the percentage of occupancy of those beds can be used to estimate federally subsidized permanent housing occupancy. While it does not report the number of beds occupied, which demonstrates the number of people no longer homeless due to the provision of housing, we can assume that the number of beds occupied amounts to one person in permanent housing.
For example, the CoC for Sacramento County, California (CA-503) reported 1,917 PSH beds and zero Rapid Rehousing (RRH) beds in 2007. Of PSH beds, the Housing Inventory Count for those beds state an 84.1 percent occupancy rate, which means that 1,612.2 persons occupied those beds and are no longer homeless. This means, roughly, that in the Sacramento CoC in 2017, around 395 units of PSH were unutilized.
The figure below compares the average counts of unsheltered homeless people with the average number of PSH occupants. There is a slight dip in unsheltered homeless people between 2012 and 2013, likely due to HUD’s change in definition. After 2014, the number of unsheltered homeless people begins to rise despite the steeper and nearly constant increase in reported occupancy in PSH programs. Counterintuitively, as more PSH units were occupied, more people remained on the street. Therefore, the provision of housing did not result in a noticeable reduction in the number of homeless people.
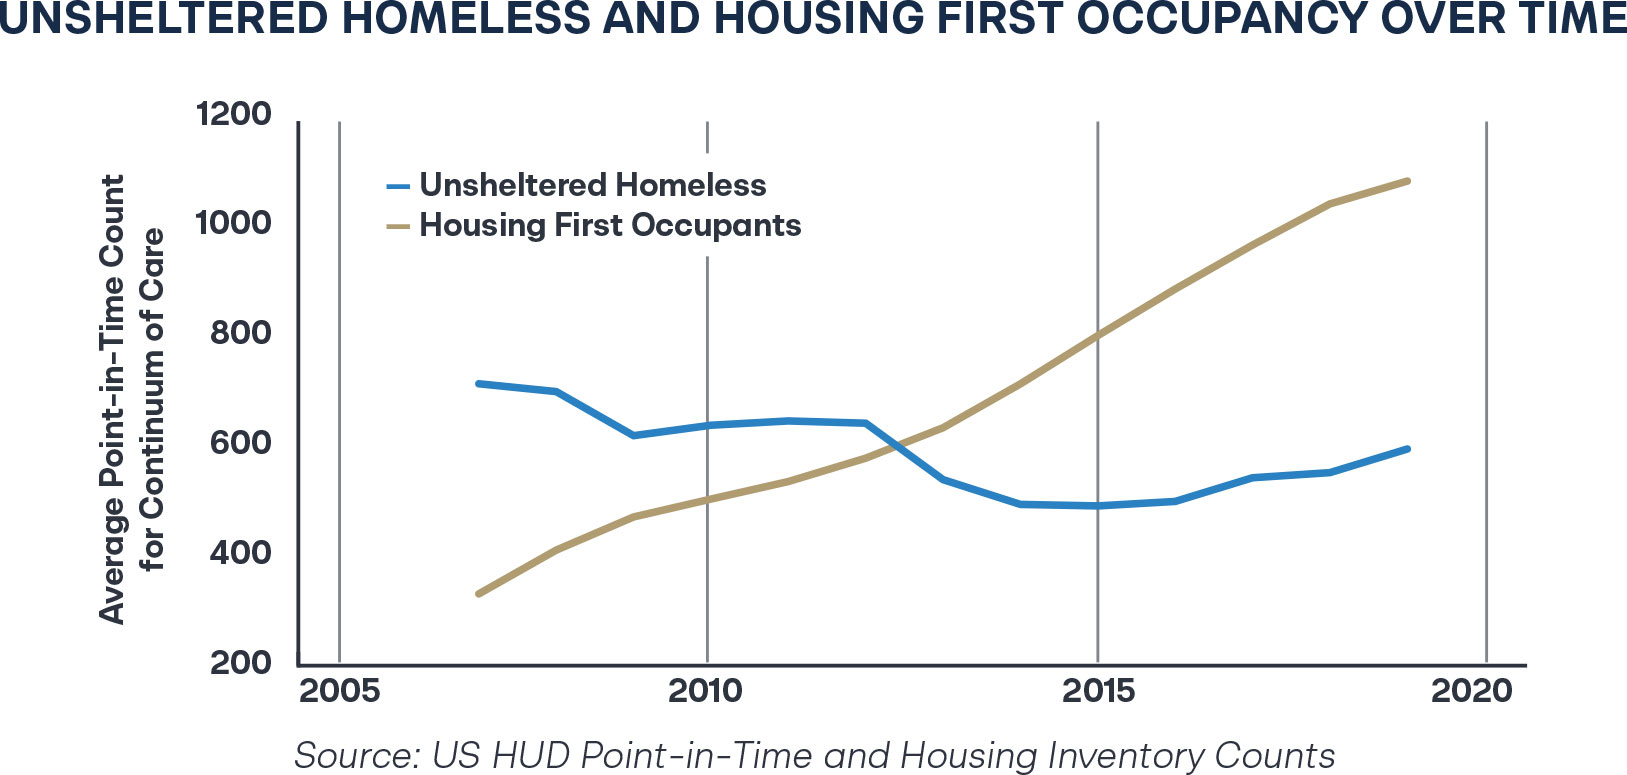
It is possible that those entering permanent housing were previously uncounted as homeless. For example, these are people who could have been living in their cars, with family or friends, or in motels. It is also possible that those at risk of becoming homeless—but are not actually homeless—are being identified and ushered into such programs. If that were occurring, the number of unsheltered homeless people would have been higher absent the federal programs. Still, it is clear from the above that the number of unsheltered homeless persons did not noticeably and significantly drop with the expansion of PSH programs. This finding suggests that the needs of this population are unmet and that units have gone unutilized.
The estimate of PSH occupants deserves discussion. The increase assumes that each unit of PSH is occupied by one formerly homeless household. The reality, however, is that these units experience multiple turnovers as occupants exit PSH to reunite with family, find other housing, return to the street, or for other unknown reasons. In fact, the greatest categories of exits from CoC systems are often “returned to homelessness” or “unknown.”3
The turnover of PSH suggests that the demand for Housing First programs is actually much lower than represented. Research from Kevin Corinth in the Journal of Housing Economics states that it takes 10 PSH units to reduce homelessness by one person.4 Without actual data on occupants and turnover per unit, it is difficult to estimate the actual slope of this curve, but all indications suggest that turnover per unit would reduce it.
HUD’s own data on total homelessness and housing created through its CoC Program supports the understanding that the provision of housing does not necessarily result in fewer people experiencing homelessness. The federal government has spent $36.6 billion since 2005 to assist communities in addressing homelessness. The national homelessness estimate of 2005 was 763,010, a mere 8,470 individuals fewer than 2024’s record-setting estimate of 771,480. In that same period, HUD’s programs created or subsidized an increase of 470,729 PSH beds for a total of 680,855. The only argument that can be considered for why the creation of half a million beds dedicated to getting people off the street failed to decrease the number of people experiencing homelessness is that the provision of beds slowed the rapid rise in homelessness. However, no evidence to date supports that argument.
HUD’s funding priorities for homelessness assistance are quite narrow. Most HUD funding is targeted for housing subsidies and data systems while very few dollars go to providing services to those who have been housed or for the unsheltered. Data collection is essential for a complete and reliable picture of the state of homelessness while housing subsidies only a segment of the homeless community (at best). Shelters, treatment programs, employment training and job placement programs, and other forms of support and transitional housing are largely the purview of state, local, and private philanthropic funds. For many areas of the country outside of wealthy urban centers, federal awards to provide expensive permanent supportive housing are the only funding available to address homelessness. Without robust supportive services, it is no wonder that many who enter permanent supportive housing often exit it.
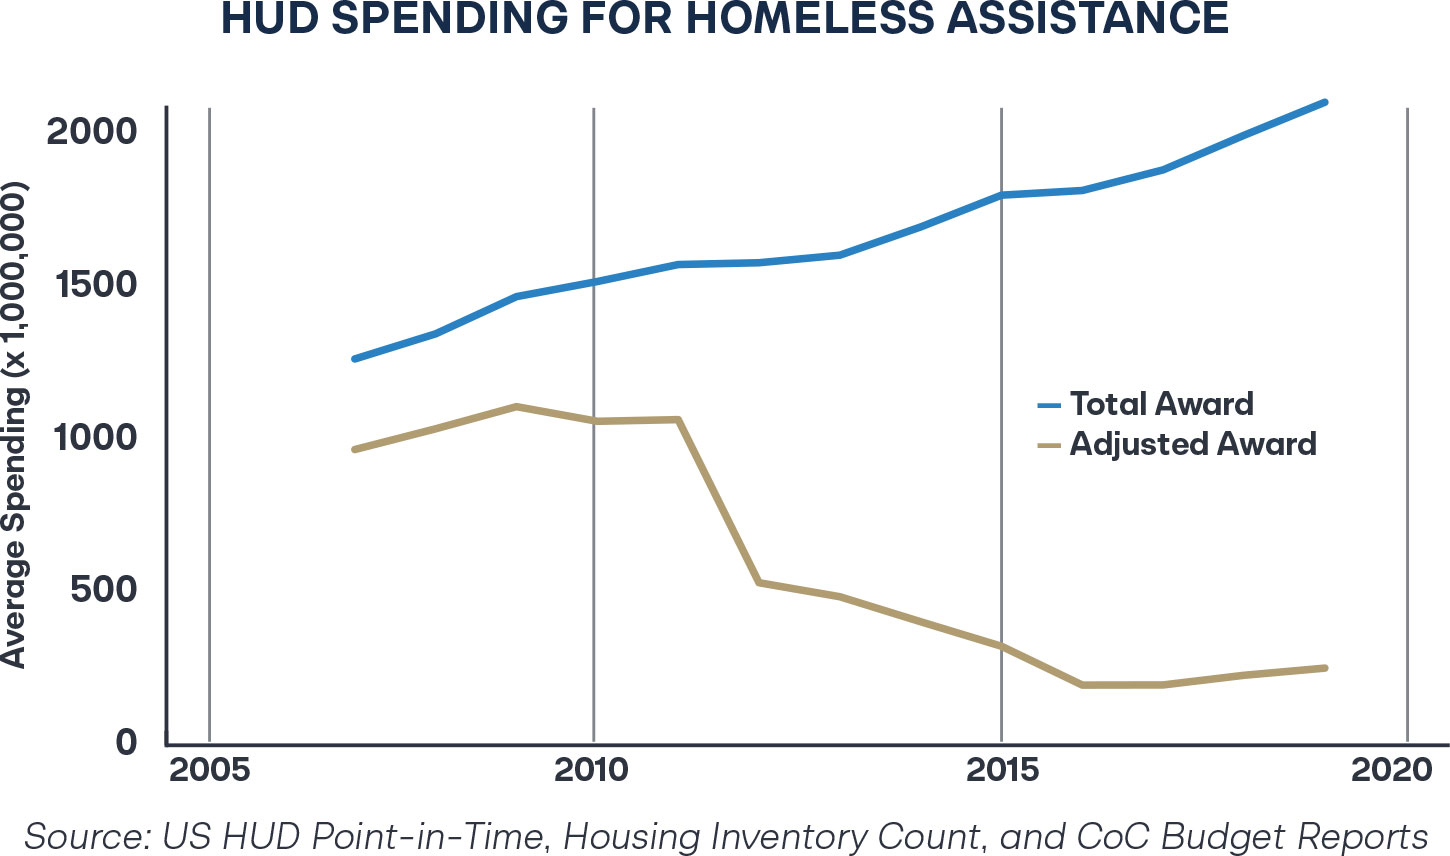
Adjusting the total awards for homelessness assistance by subtracting planning budgets, HMIS spending, and subsidized housing renewals, a gap appears signifying the award amounts for Supportive Services Only, Transitional Housing, and new permanent housing units. This gap significantly widens after 2011. In 2007, the difference was roughly $309 million. By 2019, it was nearly $2 billion. As was shown above, the number of unsheltered homeless people began to increase between 2014 and 2015. The increase in unsheltered homelessness is concerning due to the lagged impact of consolidating dollars in renewals for permanent housing. Future research could explain this trend.
Unsheltered homelessness is made up of populations with significant needs: mental health, behavioral health, or substance abuse disorders; antisocial beliefs or behavior; people seeking to evade the law; or people who, for other personal reasons, do not want to enter stable housing or shelters. Supporters of the current policy must demonstrate a causal relationship between the number of unsheltered homeless people and a demand for housing that exceeds the supply of homeless housing options. Since the homeless population has little to no market power, their behavior cannot be understood as a response to the price mechanism of a traditional housing market. Their consumption of alternatives follows for other reasons.
Those reasons are varied, diverse, and dynamic. Individuals living on the street—exposed, vulnerable, and harassed—often decline offers of housing and services. Those who do accept housing or shelter often give up their housing and return to the streets. Issues of trust, negative experiences, and cognitive or psychological limitations play a part. Counting people in such conditions is intended to assist in planning, decision making, and the meeting of needs. Yet, after more than a decade of counting, no real answers have emerged.
Based on the comparison of the Count’s results with the housing provided for people experiencing homelessness, it cannot be considered an indication of demand for housing. It cannot be considered an indication of housing effectiveness, or the success of the Continuum of Care Program in ending homelessness. It is unclear, then, what the Point-in-Time Count really measures.
i. The counts are also broken down by demography, gender, age range, and veteran status. This specificity began in the 2012 counts as HUD began requiring this data as part of implementing its system performance measures.
ii. For those interested in improving these counts, see National Law Center on Homelessness and Poverty’s Don’t Count on It: How the HUD Point-in-Time Count Underestimates the Homelessness Crisis in America.
iii. Apart from the other caveats mentioned earlier.
iv. Though it is again worth stressing that CoCs may differ in supply of permanent units and demand for such units. Our remarks throughout are general and speculative.

Stay Informed
Sign up to receive updates about our fight for policies at the state level that restore liberty through transparency and accountability in American governance.