
Improving Government Payment and Contract Data Quality in Texas

Introduction
The Texas state government has processed nearly $1.8 trillion in payments and 200,000 contracts over a decade. After filtering out statutory obligations (intergovernmental payments, interfund transfers, salaries and wages, investments, employee benefits, debt service principal and interest, and lottery winnings), $790 billion in discretionary spending remains across 27.6 million transactions.1–2
These exclusions removed only 19 percent of transactions but 56 percent of total dollars, confirming that the majority of state spending by dollar value flows through statutory obligations rather than discretionary channels.
Public transparency into how Texans’ money moves is limited by fragmented systems, inconsistent naming, and vague categorization. This report examines the structural data quality issues that undermine oversight and accountability across Texas government spending.
Data Quality
Completeness Is Not the Problem
Both datasets are over 99 percent complete across critical fields. Fourteen of 16 payment columns are 100 percent complete, and the contract database is effectively 100 percent complete across all thirteen columns. Raw completeness, in other words, is not where these systems fall short.
The Real Problem Is Linkage
Only 69 of 192 payment agencies have exact matches in the contract database, covering just 36 percent of transactions. Hard-coding additional matches brings the total to 146 of 193 payment agencies, leaving 47 payment agencies with no representation in the contract data at all.
These mismatches stem from inconsistent naming conventions. For example, the payments database lists “Department of Family and Protective Services,” while the contracts database records the same entity as “Family and Protective Services, Department Of.” There is no formal linking mechanism between payment and contract database entries.
Data Is Entered Differently Across Systems
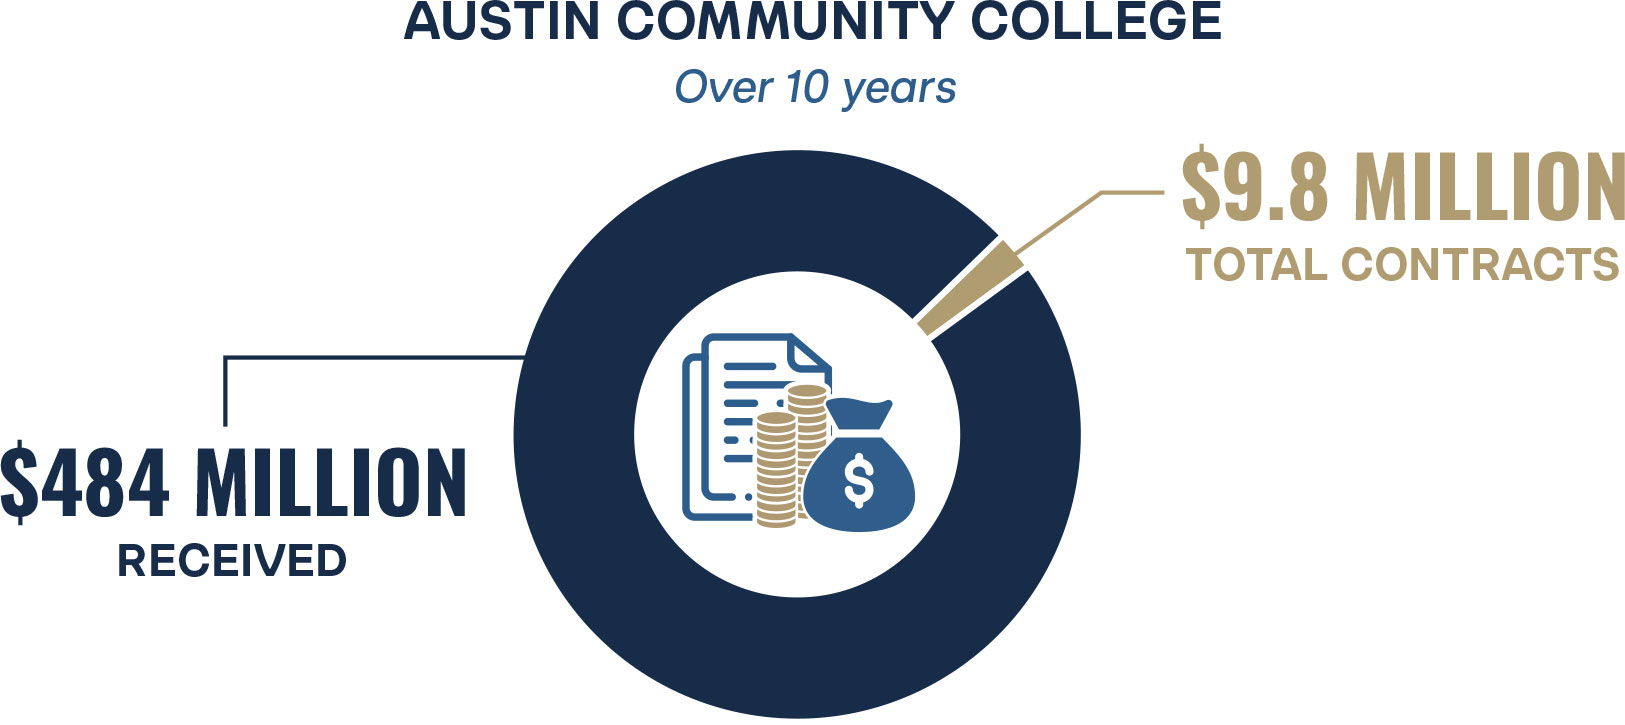
The payments and contracts databases categorize information along different dimensions, creating gaps in traceability. For community colleges, the payments database shows disbursements from the “Public Community/Junior Colleges” agency to a specific institution, such as Austin Community College. The contracts database, by contrast, shows who Austin Community College awarded contracts to, with no mechanism to link those contracts back to the associated state payment. Austin Community College has received $484 million over 10 years in state payments but only has total contracts worth $9.8 million. While much of this funding likely covers salaries and financial aid, the state should still have robust tracking in its payment or contract database to analyze where the remainder goes.
A similar problem applies to agencies that appear in both datasets. The University of Texas, for instance, has roughly $8.6 billion in total payments and $1.9 billion in total contracts. Payment categories such as Salaries and Wages, Employee Benefits, Public Assistance Payments, Travel, Interfund Transfers, Debt Service, and Investments likely do not appear in contract data, but there is no way to confirm this. Approximately $7 billion in payments fall into these categories.
Certain legislative branches and courts, including the Senate, House of Representatives, Supreme Court, and Attorney General’s Office, appear in the payment data but have no match in the contract data.
Duplicate Payments
Roughly 1.07 million transactions totaling $779 million appear as exact duplicates (same payee, same date, same amount). While the duplicate rate has declined over time, from 4.66 percent to 2.83 percent, the average dollar value per duplicate has grown from $694 to $1,659.
High-value construction duplicates are particularly concerning. Fluor Heavy Civil LLC alone accounts for $169 million in duplicate entries. Nearly 47 percent of all discretionary transactions occur in same-day clusters to the same payee, making it difficult to distinguish legitimate batch processing from split payments designed to stay under approval thresholds.
Duplicate Vendors
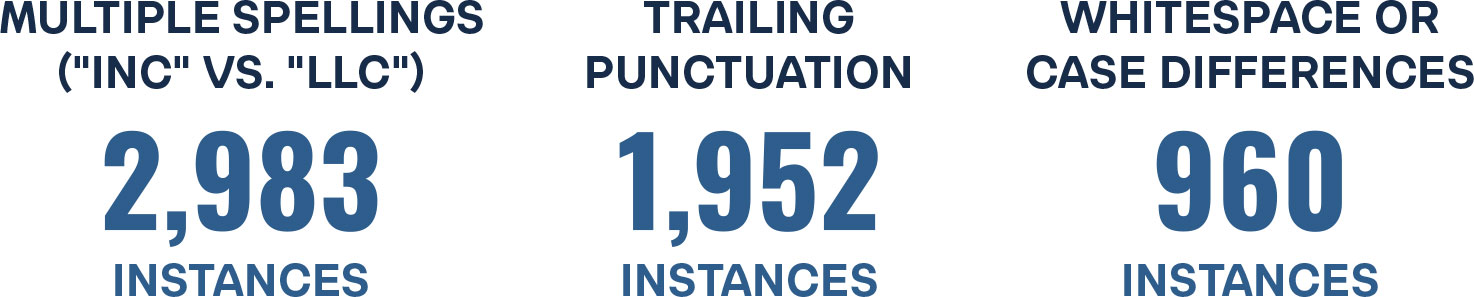
A total of 5,902 vendor-agency groups representing $82.8 billion appear under multiple spellings of the same name. The most common variations include suffix differences such as “INC” vs. “LLC” (2,983 instances), trailing punctuation (1,952 instances), and whitespace or case differences (960 instances). This fragmentation undermines oversight of the state’s largest vendor relationships.
Non-Competitive Contracting Is Rising
The non-competitive contract rate climbed from 31 percent in FY2016 to 42 percent in FY2022, representing $101 billion in total non-competitive awards. Some agencies award nearly all their contracts non-competitively: the Veterans Commission at 98.7 percent and the Texas Workforce Commission at 75.6 percent.
Low-value contracts under $25,000 carry a 10-point higher non-competitive rate than larger contracts. The “Other” category alone accounts for $41.5 billion in non-competitive spending.
Payment Reversals Spiked in FY2024
Negative payments totaled $412 million in FY2024, nearly double the prior year, producing the highest refund ratio (0.42 percent) of the decade. Some agencies show refund ratios well above the norm: the Comptroller-State Fiscal Division at 2.65 percent and UT Health Science Center Houston at 13.34 percent.
Emergency Contracting Is More Structural
Emergency contracts grew 618 percent over the decade, from 79 in FY2016 to 567 in FY2025. Even after the pandemic ended, emergency procurement runs at seven times pre-2016 levels. The largest awards during this period were tied to COVID-era PPE, testing, and border military operations.
Texas issued an average of 308 emergency contracts per year before the pandemic (FY2016–2019). After the pandemic ended (FY2023–2024), that number held at 1,094 per year, 3.6 times the pre-pandemic rate. Nearly zero COVID contracts remained; Operation Lone Star absorbed the bulk of the spend.
Non-competitive contracting counts nearly doubled post-pandemic (1.8x on an FY2018–2019 baseline), but dollar volume is essentially flat (1.07x) when excluding Military, the Department of Family and Protective Services, and the Texas Division of Emergency Management.
Direct Awards exploded from 37 per year pre-pandemic to 2,426 per year in FY2023–2024, accounting for roughly half the total increase in non-competitive contract volume while actual dollars stayed level. This pattern suggests agencies are splitting work into more, smaller no-bid contracts rather than spending more overall. Non-competitive, non-emergency awards nearly doubled from 2,396 to 4,683 per year, as universities like UT Austin (108 to 580 per year) and UTMB Galveston (10 to 470 per year) shifted routine procurement away from competitive bidding.

Legislative Budget Strategy, Agency Objectives, and Procurement Quality
When analyzing contract database information against the legislative budget strategy for each contract’s respective agency, thousands of contracts are flagged for not clearly falling within the appropriations the legislature made that year. Thousands more are flagged for suspicious payment amounts given their descriptions. However, the data quality available in the contracts database does not allow for a more thorough analysis.
While some contracts have associated documents in their Contract Management System link, these documents are not easily accessible online and are of poor quality. This makes it difficult for auditors and data analysts to definitively determine whether a contract is inappropriate and harder to identify potential fraud.
One example is a payment with the subject “Smith Hall 628-Remove sink and faucet” made by East Texas A&M University, worth $92,545 and processed on a non-emergency sole source procurement basis. The lack of detail in the subject and the absence of further associated documentation raise questions about the legitimacy of this payment.
Conversely, the lack of available information also creates false suspicion. The Texas Alcoholic Beverage Commission spent nearly $600,000 with the subject line “2023 Dodge Durango.” On face value, this would be an extremely expensive car. However, the associated documentation reveals the payment actually covered 11 Dodge Durangos.
Key Questions and Recommendations
Link payment data to contracts. Adopt a shared numeric agency identifier across the Comptroller and Legislative Budget Board systems. The current 39 percent exact-match rate makes cross-system auditing nearly impossible. Without this linkage, there is no reliable way to verify that payments correspond to valid contracts.
Make contract documentation systematically available. Require that all contract data link to a detailed invoice showing exactly what is being procured. These details should be publicly available in a format that allows data analysts and researchers to download documentation for all contracts.
Clarify how payment data is recorded, and at what point in the process. Public documentation of data practices, including variable definitions, update frequencies, revision logs, and the timing of transaction entries, would aid auditors and clarify whether exact duplicates and same-day clusters represent processing artifacts, legitimate repeat payments, or actual errors. The shift toward fewer but larger transactions concentrates risk, making the answer to this question even more important.
Establish safeguards against duplicate payments. If controls are already in place, it is worth asking why 1.07 million duplicates appear in the data, why vendor names fragment across entries, and why some vendors have inconsistent naming. A master vendor registry with unique identifiers would address the fragmentation problem.
Establish safeguards against duplicate vendor names. The 5,902 vendor-agency groups ($82.8 billion) appearing under multiple spellings of the same name, driven by suffix variations, trailing punctuation, and whitespace or case differences, fragment oversight of the state’s largest vendor relationships.
Strengthen safeguards governing low-bid and non-competitive contracts. What justifies agencies operating at 75 percent or higher non-competitive rates? What criteria determine when emergency procurement is appropriate, and what post-award auditing occurs for large emergency contracts?

Stay Informed
Sign up to receive updates about our fight for policies at the state level that restore liberty through transparency and accountability in American governance.