
U.S. FoodGrade and SNAPSmart
A Two-Step Policy to Make Healthy Eating Simple, Reward Nutritious Choices, and Reduce Diet-Related Public Spending


Issue Areas
Related Content
Diet-related chronic disease is a core driver of poor health outcomes and public spending in the United States. Forty percent of Americans are obese, and 60 percent of Americans have a chronic disease—all costing billions of dollars each year in healthcare costs.1 Diet can greatly improve health outcomes, yet, making healthier purchases can be confusing and time-consuming. Most Americans struggle to translate the dense Nutrition Facts labels into quick, wholesome choices at the point of purchase. Notably, low-income households, which rely heavily on federal and state programs, such as the Supplemental Nutritional Assistance Program (SNAP), face the steepest barriers to healthy eating.
This white paper proposes a two-step policy that links a simple, standardized front-of-package (FOP) food grade with targeted SNAP purchasing rewards. Realigning incentives creates a virtuous cycle: clearer information for everyone and smarter purchasing power for those who need it most.
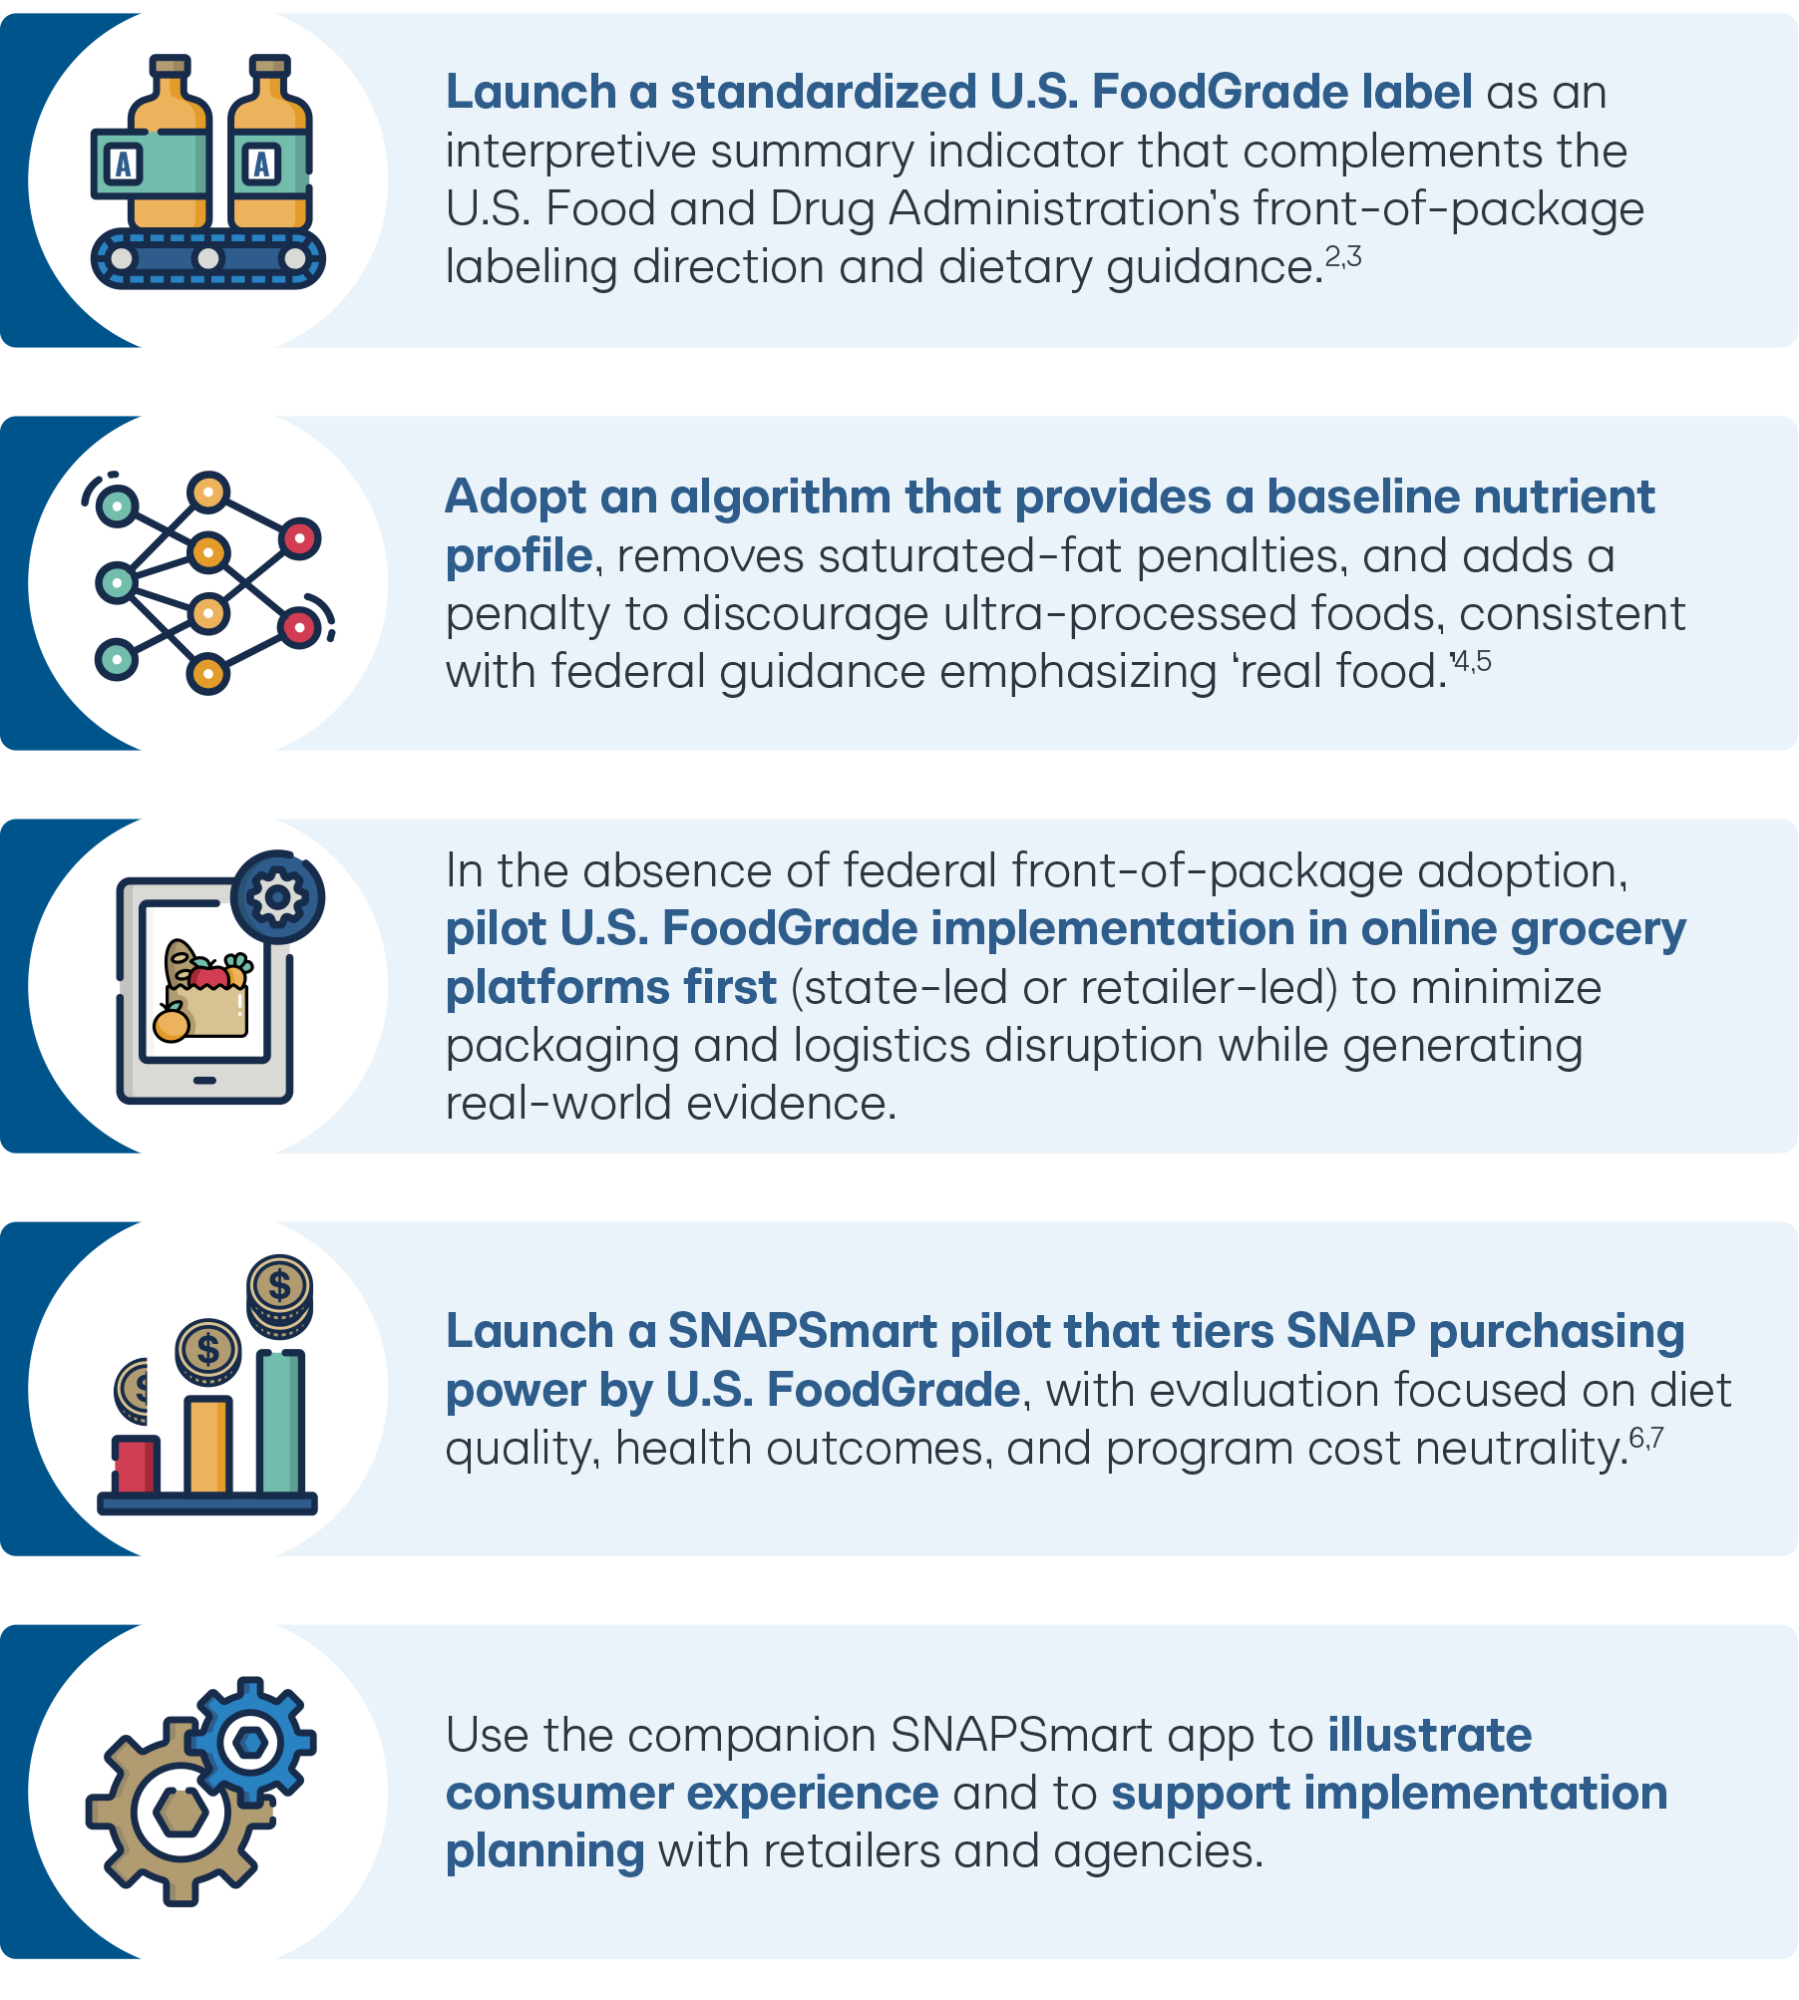
In Step One, we debut U.S. FoodGrade. Newly developed by the Cicero Institute, U.S. FoodGrade is a voluntary-to-mandatory, standardized FOP labeling program that assigns a grade to most packaged foods and to foods displayed in online grocery stores. Informed by international models, we have engineered an algorithm for the U.S. context that neutralizes saturated-fat penalties and penalizes ultra-processed foods using a NOVA based processing adjustment.
Step Two outlines SNAPSmart, a purchasing-power adjustment that creates a new “effective price” for items based on their U.S. FoodGrade. Consumers retain full freedom of choice, but the program makes higher-grade foods more affordable and lower-grade foods less subsidized. The mechanism can be piloted via USDA waivers and online grocery pilots and later scaled by federal legislation.
Together, U.S. FoodGrade and SNAPSmart offer a politically durable alternative to outright bans of certain foods and beverages. The proposed program preserves consumer autonomy, harnesses market forces to drive product reformulation, and synthesizes a transparent, evidence-based framework that can be evaluated and iterated in pilots before broad adoption.
Key Recommendations
5 https://www.cdc.gov/nchs/products/databriefs/db536.htm
Introduction: Health Outcomes, Diet Quality, and Public Costs
The American diet has become a structural health problem. Obesity prevalence remains high, and diet-related chronic disease imposes substantial costs on families, employers, and public programs. In the United States, one in five children is obese, and two out of every five adults is obese.8,9
Recent analyses estimate that obesity alone adds $56 billion annually to Medicaid spending.10
Our food system is broken, with more than half of U.S. calories coming from ultra-processed foods that contribute to obesity and with information overload at the point-of-sale compounding difficulty in finding healthy options.11,12
Recognizing these high stakes, the Cicero Institute launched a practical test of consensus. We staffed a research project with two Law and Policy Fellows from opposite dietary approaches: one committed to a plant-based diet, and the other to the carnivore diet. We asked them to research front-of-package labeling systems and return with an approach both could support. If we could design a system that bridges those two endpoints, we could build consensus for a policy that is clear enough for consumers, defensible to skeptics, and practical for regulators and retailers.
Despite their differing dietary philosophies, they reached one conclusion: consumers deserve a simple, standardized signal of overall food quality that discourages ultra-processed products engineered for overconsumption and instead prioritizes nutrient-dense whole foods.
These conditions create a policy opening: if we can change the default signals consumers see, and the default incentives SNAP recipients face, we can shift demand toward nutrient-dense foods and away from ultra-processed options without resorting to categorical bans.

Overview
The policy proposal consists of two steps. First, it establishes an innovative food labeling system, U.S. FoodGrade, tailored for the American market. Second, it leverages the U.S. FoodGrade to generate systemic change in public programs and the food industry as a whole. Step one’s newly conceived U.S. FoodGrade labeling system creates a simplified signal of food quality across the entire food system. The section on U.S. FoodGrade first compares the strengths and deficiencies of several existing food labeling programs from other developed countries and outlines adaptations needed for the American market. It then presents the U.S. FoodGrade algorithm and provides concrete examples. Finally, the section concludes with potential pathways for implementation.
Step two presents SNAPSmart. The policy proposes an approach to tuning incentives within the Supplemental Nutrition Assistance Program, where marginal price changes can have outsized effects on purchasing behavior. The first part of the section outlines the need for reform in the program. It then provides a price schedule tied to the U.S. FoodGrade labeling systems. The section ends with a summary of implementation options and important safeguards for success in the program’s rollout.
Finally, the paper ends with a link to a demo application so that policymakers can simulate consumer experience and better understand how SNAPSmart would function in the marketplace.
Step 1: U.S. FoodGrade
Regulatory Alignment: Building upon FDA’s Front-of-Package Momentum
In January 2025, the United States Food and Drug Administration (FDA) published a proposed rule that would require a standardized “Nutrition Info” box on most packaged foods. Focused on limiting saturated fat, sodium, and added sugars, this rule represents a significant commitment to reducing diet-related chronic disease.13
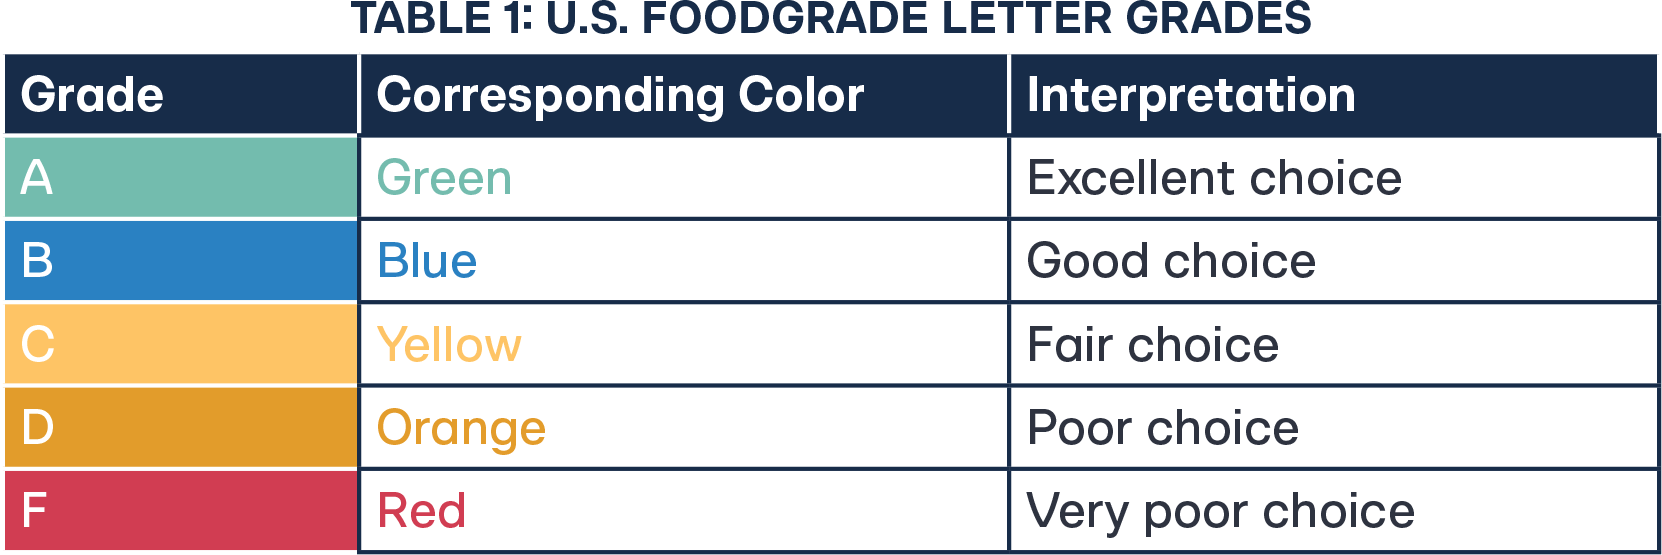
In response to the federal commitment, the Cicero Institute developed U.S. FoodGrade. The simplified labels assign each food item a letter grade (A, B, C, D, or F), which appears on the front of the physical packaging or the online grocery display. Each letter grade is allocated a color (e.g., A is green, F is red) to further ease the consumer experience. The goal is to make nutritional quality understandable at a glance, while also motivating manufacturers to reformulate products to get better health grades.
U.S. FoodGrade can be positioned as either (1) an integrated summary-grade option within the FDA’s eventual front-of-package framework, or (2) a complementary, standardized summary indicator displayed adjacent to the FDA box in a way that reinforces the Nutrition Facts label. Though formal public comment on the January 2025 proposed rule closed July 15, 2025,14 the rule has not yet been finalized as of May 2026 and remains a priority on federal regulatory agendas.15 Furthermore, a structured pilot and evidence package can inform FDA as it finalizes implementation details and future iterations.
Globally, seven nations have adopted various labeling systems with diverse results. France, Belgium, Germany, Luxembourg, the Netherlands, Spain, and Switzerland have formally adopted or committed to implementing Nutri-Score, making it the most widely adopted front-of-package labeling system in Europe. The following section evaluates the strengths and deficiencies of existing systems before recommending an Americanized framework.
Evaluating the Global Landscape
Front-of-package systems generally fall into two categories: non-interpretive/informative labels that provide numbers without evaluative judgment or direction for the consumer, and interpretive/directive labels that translate nutrition into an evaluative signal. For example, the existing “Nutrition Facts” U.S. food labels are non-interpretive; they provide facts but are difficult for the average consumer to evaluate at a glance. Interpretive systems can be nutrient-specific (e.g., color-coded “traffic lights” per nutrient) or summary indicators (e.g., a single score or endorsement).
Comparative studies generally find interpretive summary labels are easier to use for rapid comparisons, while non-interpretive approaches may be preferred by some consumers but often show smaller effects on quick decision-making.16 Nutrient-specific labels that grade individual components by color—commonly known as ‘traffic lights’—indicate whether each nutrient is healthy, neutral, or unhealthy. Popcorn, for example, may receive a green light for being low in calories but a red light for being high in sodium. A single-score system provides a general rating for the food item as a whole. Under this system, popcorn may receive a rating of B, C, or D, depending on all relevant nutritional factors taken into account.
Nutri-Score
Nutri-Score is a food-grading system widely adopted across multiple European countries and has been studied extensively.17,18,19 Derived from the UK Food Standards Agency/Ofcom nutrient profiling model, Nutri-Score focuses on both labeling and reformulation of foods.20,21
The Nutri-Score system uses a color-coded letter grade (A through E, dark green to dark orange) based on an algorithm that calculates nutritional quality per 100 grams. The algorithm assigns positive points for unfavorable components such as energy (calories), saturated fats, sugar, and sodium. The algorithm subtracts points for dietary fiber, protein, and the content of fruits and vegetables. The final score determines the grade on the packaging. If the food is lower in points, it will get an A. If the food is higher in points, it will be downgraded to a lower grade.
The European Consumer Organization (BEUC) argues that the front-of-package label for Nutri-Score enhances consumer comprehension and enables quick product comparisons compared to monochrome or portion-based alternatives. It is color-coded, evaluative, and standardized per 100g/100ml. However, BEUC emphasizes that these advantages are undermined by NutriScore’s voluntary status at the EU level, which allows manufacturers with poor scores to simply opt out, resulting in inconsistent coverage that hinders adequate consumer understanding.22 It assigns a single graded, color-coded letter to foods based on a transparent nutrient-profiling algorithm. Nutri-Score’s strengths are its simplicity for consumers and its transparency for manufacturers, creating credible ‘reformulation pressure’ across the food supply.
The Nutri-Score algorithm balances unfavorable nutritional components against favorable components to generate a final nutritional score. In the Nutri-Score framework, unfavorable components include energy density (measured in kilojoules), saturated fats, total sugars, and sodium. For beverages specifically, the presence of non-nutritive sweeteners receives an additional penalty to discourage their consumption.23 Favorable components—dietary fiber, protein, and the percentage of fruits, vegetables, and legumes—receive negative points that offset unfavorable scores. The algorithm calculates the final score by subtracting favorable points from unfavorable points, with specific computational rules varying by product category.
However, Nutri-Score does have a few significant limitations. First, there is a saturated-fat bias: the standard algorithm penalizes saturated fat uniformly, which can downgrade nutrient-dense whole foods. Second, it lacks a sufficient processing signal: a product engineered to appear ‘healthy’ on a nutrient panel can score well despite being ultra-processed. The algorithm underwent significant revision in 2023–2024 to improve alignment with food-based dietary guidelines across participating countries, including removing nuts and oils from the fruits/vegetables/legumes category, limiting protein points for red-meat products, and tightening exemptions that had allowed high-sodium processed foods to achieve favorable scores. Yet these adjustments still treat saturated fat primarily as a negative nutrient and do not distinguish between minimally processed foods and ultra-processed products.
Nordic Keyhole
The Nordic Keyhole is a voluntary, government-backed symbol that indicates a ‘healthier choice’ within specified product categories, based on criteria for salt, sugars, fat, and fiber/whole grain. It is an interpretative binary endorsement, a simple ‘yes/no’ cue for consumers.24 Binary endorsement can be a powerful cue, but it does not provide gradation across the full food supply and is less suited to fine-grained incentives (like tiered SNAP multipliers discussed later in this paper).
NutrInform Battery
NutrInform Battery is an Italian-developed system that displays per-serving nutrient quantities using a battery icon metaphor, emphasizing information rather than evaluative judgment.25 This approach can support informed decisions for highly engaged consumers, but it requires more time and numeracy at the point of purchase.
Empirical work suggests that Keyhole and Nutri-Score can yield different classifications for the same products, underscoring the importance of explicitly specifying what the label is optimizing for (nutrients vs. category-based criteria vs. processing methods).26
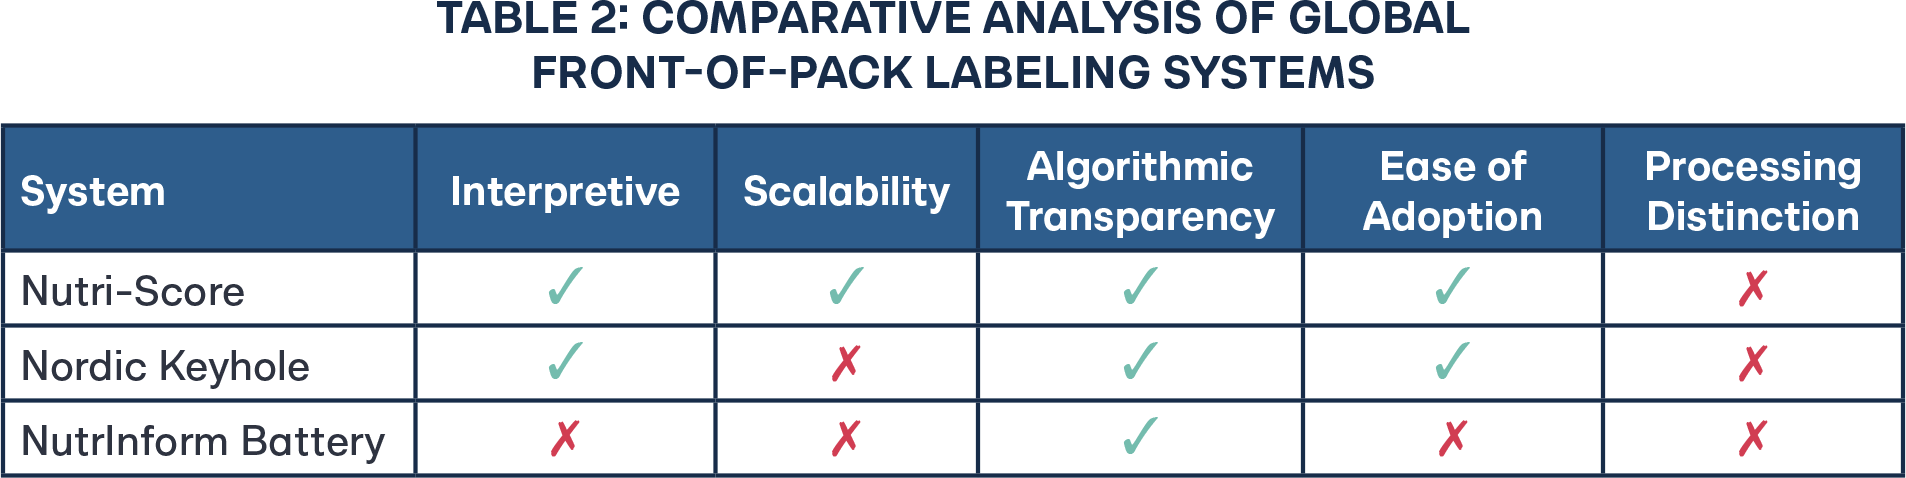
Column Definitions
Interpretive. Whether the label translates complex nutritional data into a simplified, evaluative signal that communicates overall product quality at a glance. An interpretive system makes a judgment on behalf of the consumer (e.g., “this product is a B” or “this product qualifies as a healthier choice”), as opposed to presenting raw nutrient values that require the consumer to draw their own conclusions. This distinction is critical in the SNAP context, where point-of-purchase decisions are made under time pressure and where nutritional literacy varies widely across the eligible population.
Scalability. Whether the system can be applied uniformly across a broad range of food categories and retail environments without requiring category-by-category customization or manufacturer-defined parameters that compromise cross-product comparability. A scalable system uses a consistent methodology—whether algorithmic or threshold-based—that produces comparable outputs regardless of product type. Systems that rely on manufacturer-set portion sizes or that require separate criteria development for each food category score lower on this dimension because they introduce fragmentation that limits population-level deployment.
Algorithmic Transparency. Whether the system’s scoring methodology, criteria, or classification logic is publicly documented, independently verifiable, and subject to external scrutiny. This includes both complex weighted algorithms (as in Nutri-Score) and simpler threshold-based criteria (as in the Nordic Keyhole), provided the underlying decision rules are published and accessible. Transparency is assessed on the basis of public availability and auditability, not on the complexity or granularity of the methodology itself.
Ease of Adoption. Whether the system can be realistically implemented at scale given existing industry infrastructure, political conditions, and consumer readiness. This dimension accounts for the practical barriers to deployment: manufacturer compliance costs, political opposition, consumer education requirements, and the track record of voluntary uptake. A system may be scientifically rigorous but score poorly here if it faces entrenched resistance or requires wholesale packaging and supply chain redesign.
Processing Distinction. Whether the system incorporates a mechanism for differentiating between minimally processed whole foods and ultra-processed products. This is distinct from nutrient profiling: a product may have an acceptable macronutrient composition while still being ultra-processed, with associated health risks that nutrient-level analysis alone cannot capture. Systems that score positively on this dimension integrate a processing-level signal— such as a NOVA-based classification penalty—into their evaluation framework, rather than relying exclusively on compositional nutrient data.
Column Explanations
Interpretive
Nutri-Score employs a five-color, letter-graded scale (A through E) that synthesizes multiple nutritional dimensions into a single, immediately legible signal. The simplified front-of-pack summary indicator translates a composite nutrient profiling score into a color-coded grade that allows consumers to compare products across categories without interpreting raw nutrient values.27 The 2023–2024 algorithmic revision refined the scoring model to better align with current dietary guidelines while preserving this interpretive architecture.28
The Nordic Keyhole functions as a binary endorsement: products either meet the threshold criteria for their food category, or they do not. The Keyhole symbol provides an unambiguous positive signal—consumers do not need to decode a scale or perform comparisons.29 The Keyhole’s strength lies in rapid decision-making at the point of purchase, particularly for consumers with lower nutritional literacy.30
NutrInform Battery displays the percentage of daily reference intake for individual nutrients (energy, fat, saturated fat, sugars, and salt) using a battery-fill icon.31 Rather than interpreting overall product quality for the consumer, it presents disaggregated numerical data. This format requires significantly more cognitive effort than summary-grade systems, and the battery metaphor itself is counterintuitive: an empty battery indicates a healthier choice, which contradicts the universal association of a full battery with something positive.32
U.S. FoodGrade uses an A, B, C, D, F letter grading system, deliberately modeled on the American school-grade framework that is universally recognized across U.S. demographic and socioeconomic groups. Unlike Nutri-Score’s A-through-E European convention, the inclusion of “F” as a failing grade leverages a cultural shorthand that requires no explanation: American consumers already understand that an A is excellent, a C is mediocre, and an F means failure. Each letter grade is paired with a color signal (green through red) that reinforces the evaluative message for consumers who process visual cues faster than text. This dual-channel design—familiar letter grade plus intuitive color—provides SNAP-eligible consumers with an immediate judgment about product quality that does not depend on nutritional literacy, numeracy, or the ability to compare raw nutrient values across products.
Scalability
Nutri-Score’s single algorithm applies uniformly across food categories and national borders, making it inherently scalable. It has been adopted or endorsed by seven European countries (France, Belgium, Germany, Luxembourg, the Netherlands, Spain, and Switzerland), and over 1,000 companies representing more than 1,400 brands have registered to use it.33 The 2023–2024 algorithmic update maintained this cross-category applicability while refining the scoring model.34
The Nordic Keyhole applies category-specific nutritional thresholds—separate criteria for bread, dairy, ready meals, and so on—which means each new product category requires its own set of defined standards.35 While this ensures nutritional relevance within each category, it limits the system’s ability to scale rapidly into new or highly processed product segments without extensive committee deliberation and standard-setting.36
NutrInform Battery’s per-nutrient template can theoretically apply to any product, but in practice its scalability is undermined by the portion-size problem. Because manufacturers define their own serving sizes, cross-product comparison becomes functionally unreliable. Portion-based formats allow substantial variation in declared serving sizes across products, making it difficult for consumers to draw meaningful comparisons.37,38
U.S. FoodGrade is designed around a single, unified algorithm that applies across the full spectrum of food products available in U.S. retail environments, across the wide range of products sold in U.S. supermarkets and the more limited but highly variable inventory typical of SNAP-authorized retailers. The system does not require category-by-category threshold development or manufacturer-defined portion sizes. Its scoring methodology operates on standardized reference amounts already established under the Nutrition Labeling and Education Act, ensuring consistent cross-product comparability without the fragmentation that has limited the Keyhole’s scalability and the portion-size variability that undermines NutrInform.39
Algorithmic Transparency
Nutri-Score’s algorithm is publicly available, peer-reviewed, and has been the subject of extensive independent evaluation. The original scoring methodology has been published in full, enabling external replication and critique.40 The 2023–2024 revision process was conducted openly, with documented changes including the removal of nuts and olive/rapeseed/walnut oils from the fruit category, limitations on red meat protein point accrual, and elimination of the protein cap exemption for products exceeding certain negative-nutrient thresholds.41
The Nordic Keyhole’s category-specific thresholds are published by Scandinavian food authorities and are publicly accessible.42 While the criteria are simpler than Nutri-Score’s weighted algorithm, consisting of binary cutoffs for fat, sugar, salt, and fiber within each food category, this simplicity does not equate to opacity. The thresholds are transparent, government-set, and periodically reviewed.43
NutrInform Battery presents raw nutrient percentages alongside established daily reference intakes, making the underlying calculations fully visible to consumers.44 There is no hidden weighting or algorithmic transformation—what appears on the label is a direct calculation. Italy’s advocacy for this system has explicitly positioned its transparency as a counter to NutriScore’s perceived algorithmic complexity.45
U.S. FoodGrade’s scoring methodology is designed for full public disclosure, with each component of the algorithm—the nutrient profiling score, the NOVA-based processing penalty, and the composite grade calculation—documented and available for independent review. The system builds the precedent of open-source algorithmic design while extending transparency to the processing-level dimension, which has not previously been subject to this degree of methodological formalization in a front-of-pack labeling context.46
Ease of Adoption
Despite significant industry and political opposition, Nutri-Score has been voluntarily adopted across seven countries.47 The 2023–2024 algorithm revision introduced transition costs: products previously scored under the old algorithm needed recalculation, and the rollout was not synchronized across adopting countries.48 Notably, within just three years of adoption in France, over 1,000 companies representing more than 1,400 brands had registered to use the label, accounting for approximately half of food sales by volume.49
The Nordic Keyhole benefits from decades of implementation history, beginning in Sweden in 1989. Its voluntary, non-punitive design—products either qualify, or they simply don’t carry the symbol—has generated minimal industry opposition.50 The system’s longevity and simplicity make it the easiest of the three to adopt, though its category-specific nature means its application is limited.51
NutrInform Battery remains largely confined to Italy and has not achieved significant voluntary adoption beyond pilot programs.52 Its design requires substantial consumer education investment, and the battery-icon format introduces a level of informational complexity that may reduce usability in large-scale programs such as SNAP, which serve diverse populations with varying levels of nutrition literacy.53
U.S. FoodGrade is purpose-built for the American regulatory and retail environment, leveraging infrastructure that already exists. The system is designed to operate within the existing SNAP Electronic Benefit Transfer (EBT) framework, using product-level data that retailers already capture at the point of sale through the Global Trade Identification Number (GTIN) and Global Product Classification (GPC) taxonomies.54 Rather than requiring voluntary manufacturer opt-in or wholesale packaging redesign, FoodGrade can be implemented through retailer-facing shelf labels and digital integration, reducing the adoption burden on both manufacturers and consumers. The A, B, C, D, F grading convention further lowers the adoption barrier: FoodGrade’s school-grade framework is immediately intuitive to American audiences and requires zero consumer education to interpret. Its design also accounts for the political landscape: by incorporating a processing-level dimension that aligns with the current bipartisan interest in reducing the consumption of ultra-processed food—including the waiver programs now active in 18 states—FoodGrade is positioned to complement rather than compete with existing policy momentum.55
Processing Distinction
Nutri-Score evaluates nutrient composition through an algorithm that weights positive and negative nutritional factors, but it does not account for the degree of industrial processing a product has undergone. An ultra-processed cereal bar fortified with vitamins can score comparably to a minimally processed whole food, because the algorithm cannot distinguish between intrinsic and added nutrients. The 2023–2024 revision attempted to address some of these distortions but did not introduce a systematic processing penalty.56 Nutrient-profiling systems based solely on compositional data can diverge substantially in how they classify foods’ nutritional quality, underscoring that composition-only models may miss other risk-relevant dimensions such as degree of processing.57
The Nordic Keyhole’s category thresholds set nutrient benchmarks within food groups but are agnostic to processing level. A product that meets the fiber, fat, and sodium thresholds for its category qualifies for the Keyhole regardless of whether it is a whole-grain bread or a heavily processed bread product with equivalent macronutrient values.58,59
NutrInform Battery, as a purely informational display of nutrient quantities, makes no distinction whatsoever between processing levels.60 It reports what is in the food, not how the food was made. This means the system is structurally incapable of signaling processing-related risks of ultra-processed food consumption, which CDC data and NIH-supported research have linked to increased rates of obesity, cardiovascular disease, and metabolic disorders among U.S. adults.61,62
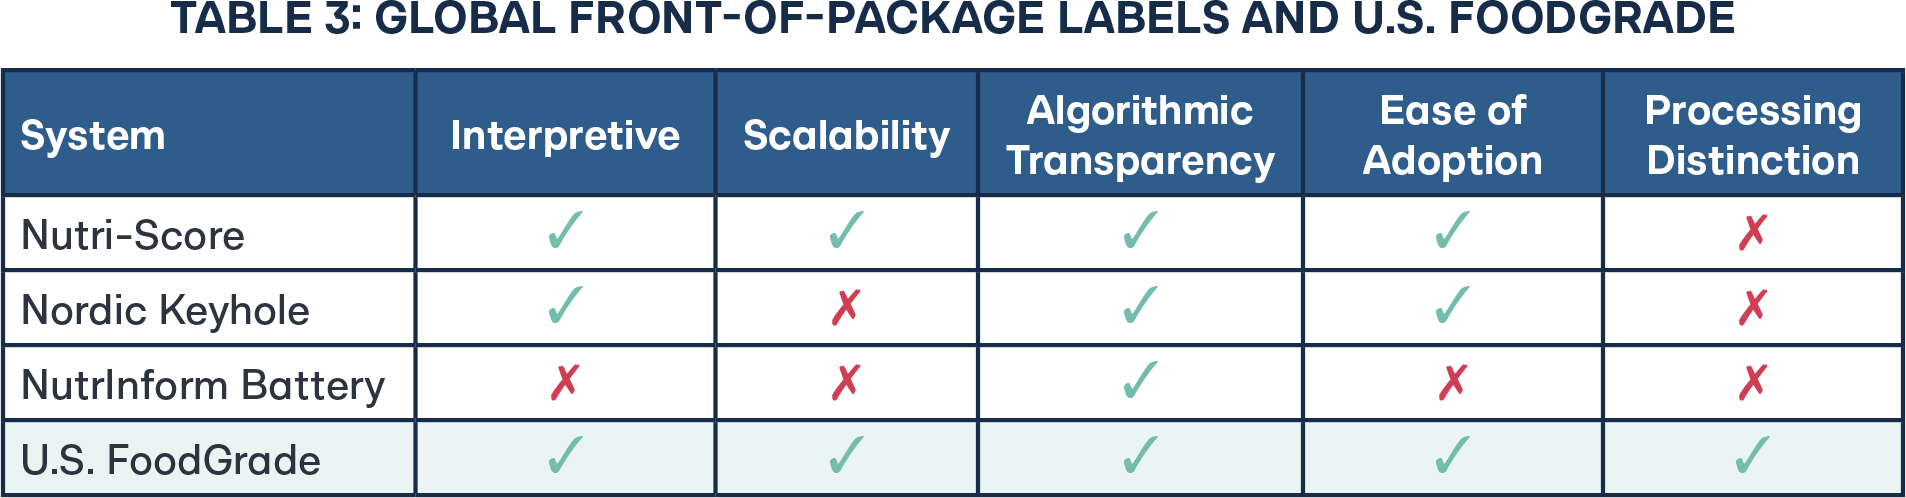
U.S. FoodGrade is the only system in this comparison that integrates a processing-level distinction into its scoring framework. Drawing on the NOVA classification system, FoodGrade applies a penalty to ultra-processed products (NOVA Group 4) that adjusts the composite grade downward based on the degree of industrial processing.63 This means that two products with identical macronutrient profiles will receive different FoodGrade scores if one is minimally processed and the other is ultra-processed—a distinction that none of the existing European systems can make. This processing penalty addresses the central limitation identified across all three comparator systems and represents the core innovation of the FoodGrade framework.
Among the systems reviewed, Nutri-Score offers the best combination of (1) immediate consumer interpretation, (2) scalability across categories, (3) algorithmic transparency, and (4) ease of adoption—making it the strongest foundation for a U.S. summary-grade program. However, Nutri-Score contains two major deficiencies: saturated fat bias and lack of a penalty for highly processed foods. U.S. FoodGrade retains the advantages of Nutri-Score while also correcting for this weaknesses.
Proposed U.S. FoodGrade Methodology
U.S. FoodGrade is calibrated against validated nutrient-profiling standards, similar to Nutri-Score. First, it calculates the base nutrient profile, and then applies two U.S.-specific corrective measures:
- Modification 1: Neutralizes saturated fat deductions. Saturated fat remains displayed on labels for transparency but does not reduce the overall grade. This avoids potential miscategorization of nutrient-dense foods such as whole milk or eggs while preserving information for consumers who wish to limit saturated fat.
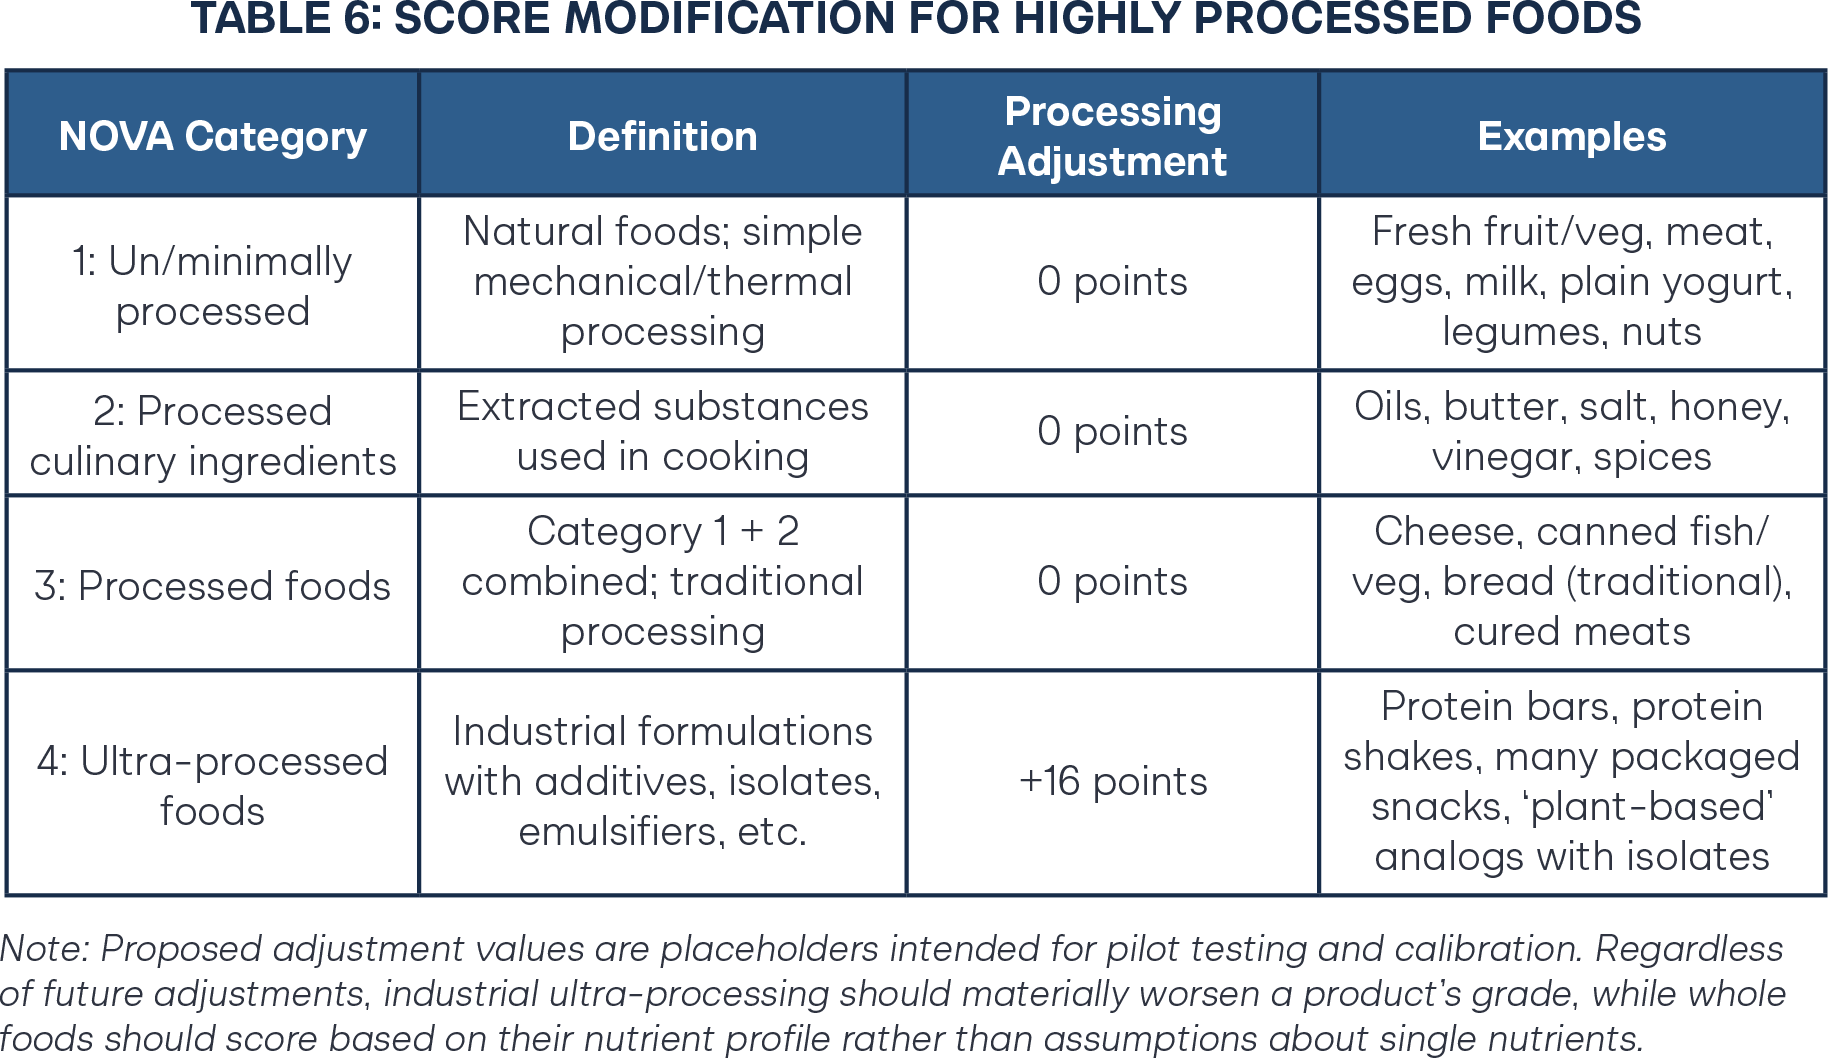
- Modification 2: Adds a penalty for highly processed foods. NOVA is a food classification system that categorizes foods into four groups based on the level of industrial processing. Under the U.S. FoodGrade system, each food receives a score adjustment that penalizes ultra-processed formulations. Minimally processed whole foods, such as aged cheddar cheese, do not receive a penalty. This aligns with federal guidance that emphasizes limiting ultra and highly processed foods.64,65,66
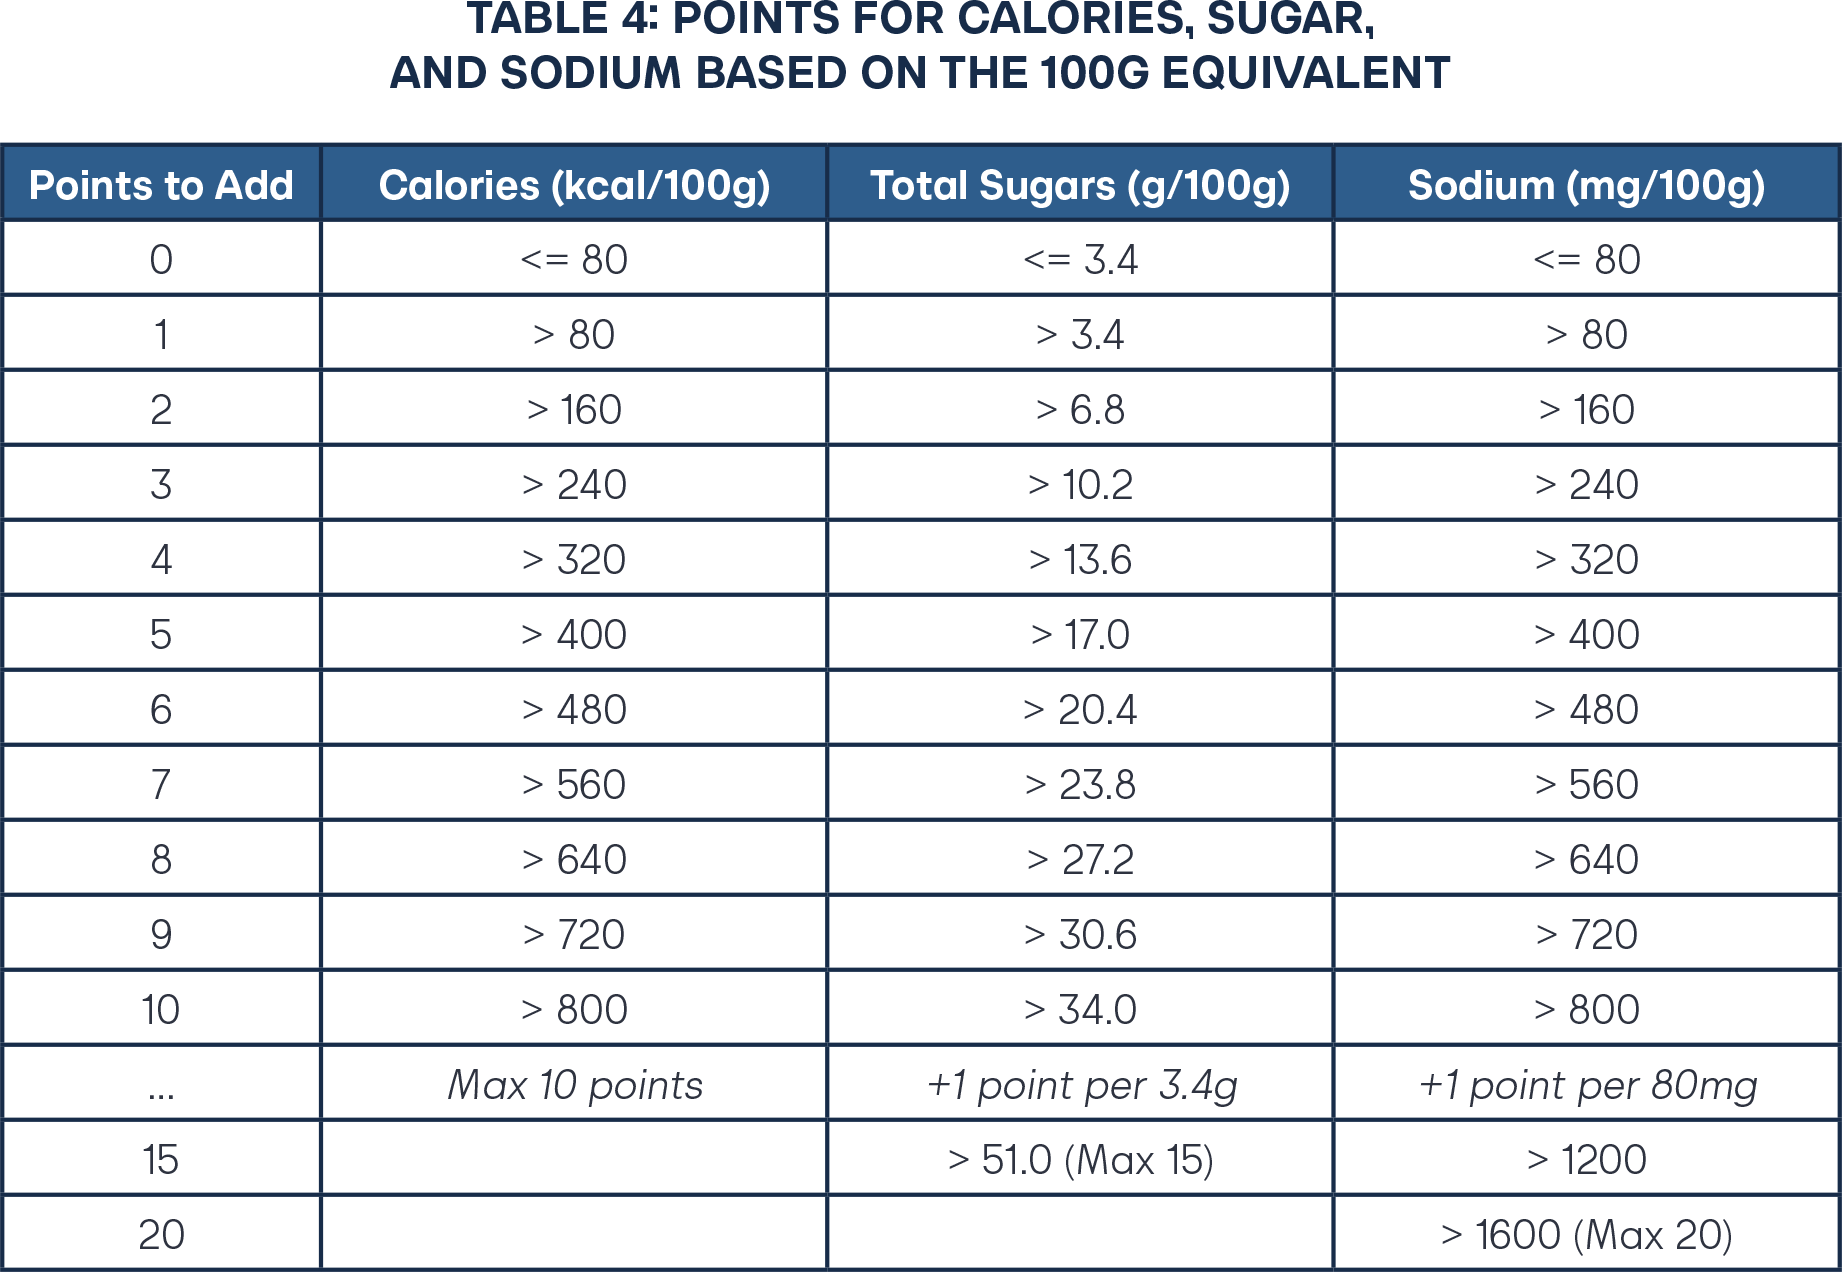
All general food calculations must be based on exactly 100 grams of the product. If the serving size on the label is different (e.g., 50g), you must multiply or divide the label’s values to find the 100g equivalent before assigning points.
Products such as beverages and oils have compositions that differ substantially from general food items and therefore require modified scoring rules. To maintain consistency in the scoring framework, categories such as beverages, fats, and oils are excluded from this analysis. Future iterations of the model will create category-specific adjustments for beverages, fats, and oils.
Formula 1
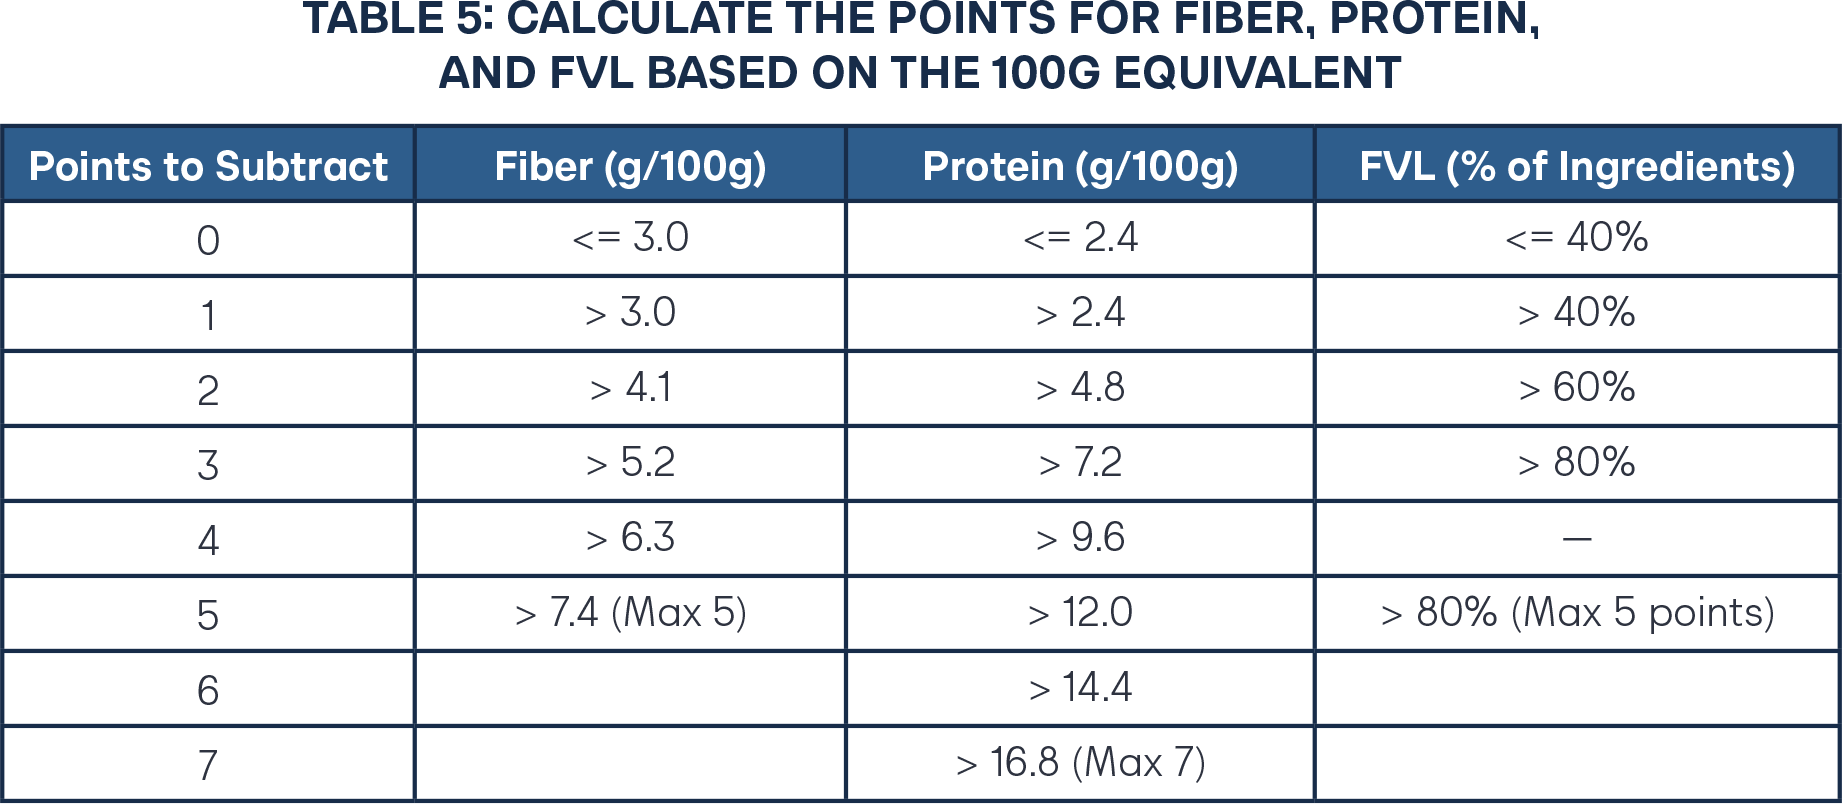
Base Nutrient Score = (Energy Points + Sugar Points + Sodium Points) -(FVL Points + Fiber Points + Protein Points)
Put simply, the U.S. FoodGrade score is derived from the following formula:
Formula 2
FINAL SCORE = [Base Nutrient Score] + [NOVA Score Food Penalty]
The base nutrient score can be calculated using per 100g values from the Nutrition Facts label (calories, sugar, sodium; offset by fiber, protein, and fruit/vegetable/legume percentages).
Then, additional points are added if the food is ultra-processed. Once the final score is calculated, it should be mapped to the U.S. FoodGrade letter, which can then be displayed on packages and online interfaces.
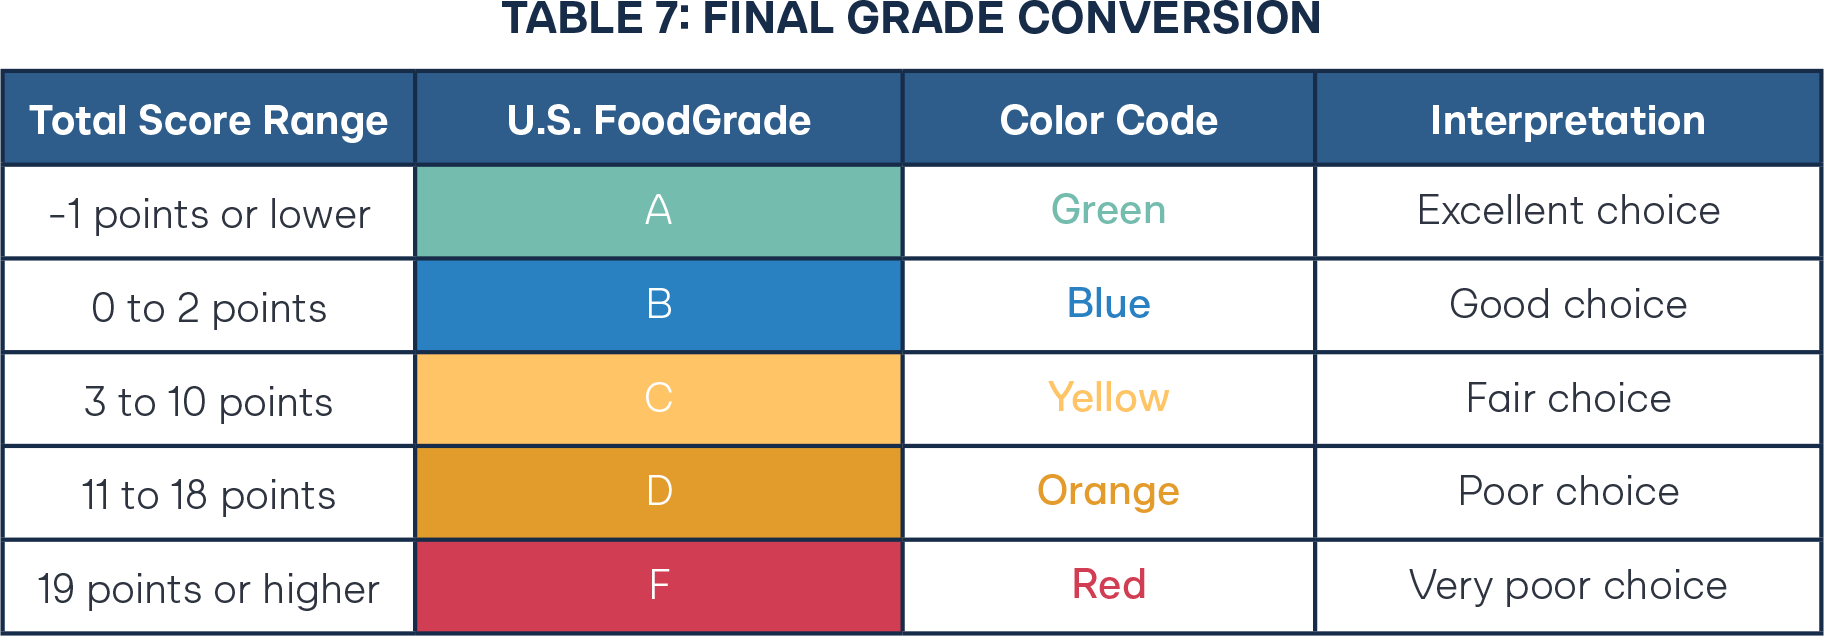
Under this system, higher points lead to lower grades. For the best grades, products should aim to have as few points as possible.
Notably, the entire calculation process across the food chain can be done seamlessly with the aid of large language models. Scores can be obtained through federally required Nutrition Facts labels. A recent LLM trained on food products identified NOVA categories with 98.29 percent accuracy.67
Click here to access a US FoodGrade calculator and learn about a food’s US FoodGrade.
Illustrative Examples
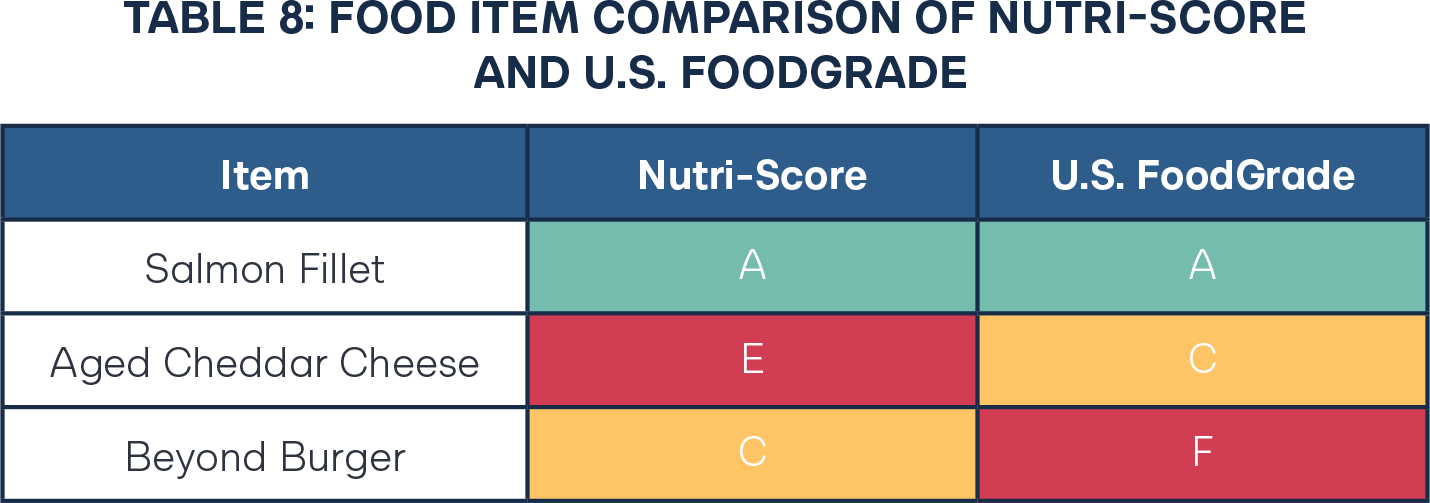
The standard Nutri-Score system tends to severely downgrade cheese due to a bias against saturated fat even in whole foods; U.S. FoodGrade removes that automatic penalty and applies an adjustment for ultra-processed foods, resulting in a higher (and more intuitive) grade for a nutrient-dense, traditionally processed food. Some plant-based meats score well in nutrient-only systems due to protein and fiber fortification; U.S. FoodGrade applies an ultra-processing penalty that moves these products into a lower grade when appropriate. Similarly, ready-to-drink meal replacement shakes and protein bars often appear ‘healthy’ on a nutrient panel, but ultra-processing and additive reliance push them toward D/F in U.S. FoodGrade.
U.S. FoodGrade directly operationalizes the Dietary Guidelines’ emphasis on “real food” and on limiting highly processed foods as a practical way to meet dietary fat goals.68 It also aligns with FDA’s increasing focus on providing interpretive, at-a-glance nutrition information.69,70
Implementation Pathways for U.S. FoodGrade
Preferred: Integrate into FDA’s Front-of-Package Labeling Framework
FDA’s proposed rule creates an opening to standardize interpretive signals on the front of packages.71 U.S. FoodGrade could be incorporated as a front-of-package summary indicator (similar to international models), either as a required element or as a standardized alternative for manufacturers that are meeting data and display requirements.
Alternative: State-Led Online Grocery Pilot
A state-by-state approach could lead to a regulatory patchwork that could create logistical issues for the distribution of food products with different labeling requirements. To avoid immediate packaging disruption, a state could require U.S. FoodGrade for online-only grocery interfaces (including retailer apps and websites), where the grade can be displayed next to the item price and Nutrition Facts information. This approach pilots consumer response, technical feasibility, and retailer integration before expanding to physical packaging.
Success of either plan would be evaluated by changes in the quality of a typical grocery purchase by an average consumer (i.e., “basket quality”) or the average U.S. FoodGrade score. It could measure substitution patterns, especially in analyses of consumer buying history. As consumers adjust their buying habits, retailers and manufacturers are likely to introduce product reformulations, which could be tracked. Polls could measure consumer comprehension and trust. Over time, downstream health proxies could be measured (e.g., Healthy Eating Index scores, self-reported consumption, claims-based outcomes in SNAPSmart pilots).
Step 2: SNAPSmart, Tiered Purchasing Power
The Supplemental Nutrition Assistance Program (SNAP) was created to reduce hunger and improve nutrition among low-income Americans. In the earliest food stamp programs, there were roughly 380,000 recipients; today, SNAP supports an average of about 41.7 million people per month—approximately 12 percent of the U.S. population.72,73 There is a striking gap between the original goal of SNAP, which is to reduce hunger, and the health problems that face recipients today: obesity and chronic disease. SNAP is not associated with better health outcomes. Research shows that SNAP participants have lower Healthy Eating Index scores than their non-recipient counterparts.74 Today, SNAP meaningfully reduces food insecurity but does not reliably improve diet quality at scale—and diet-related disease remains disproportionately concentrated among low-income households.75
Why SNAP Urgently Needs a Nutrition Upgrade
SNAP purchasing rules largely mirror the FDA’s broad definition of ‘food’ and allow recipients to purchase many products with little to no nutritional value. Low-income populations have higher exposure to ultra-processed foods and face higher rates of obesity and related conditions.76,77 These health outcomes translate into public spending: Medicaid is a primary payer for low-income adults, and obesity alone is estimated to add more than $50 billion annually to Medicaid costs.78 Even modest improvements in diet quality among SNAP households could therefore yield meaningful downstream savings.
While 18 states have recently sought waivers to restrict purchases of items such as soda and candy, the United States Department of Agriculture (USDA) has historically not approved such restrictions.79,80 This waiver approach curtails consumer choice by banning specific items outright without the added benefit of educating consumers on healthy choices; a FoodGrade system integrated with SNAP would instead allow recipients to spend their SNAP dollars while nudging them toward healthier options. The banning strategy has produced recurring political battles—often framed as autonomy versus paternalism and subject to partisan winds—without durable improvement in diet quality.
SNAPSmart reframes the debate: rather than banning products, it tunes the subsidy. The program provides granularity, rewards higher-quality foods, and reduces dollars going toward low-quality, ultra-processed foods. It could be used to maintain total choice or paired with product-specific bans. The table below provides an example of what tiered purchasing power could look like under such a system.
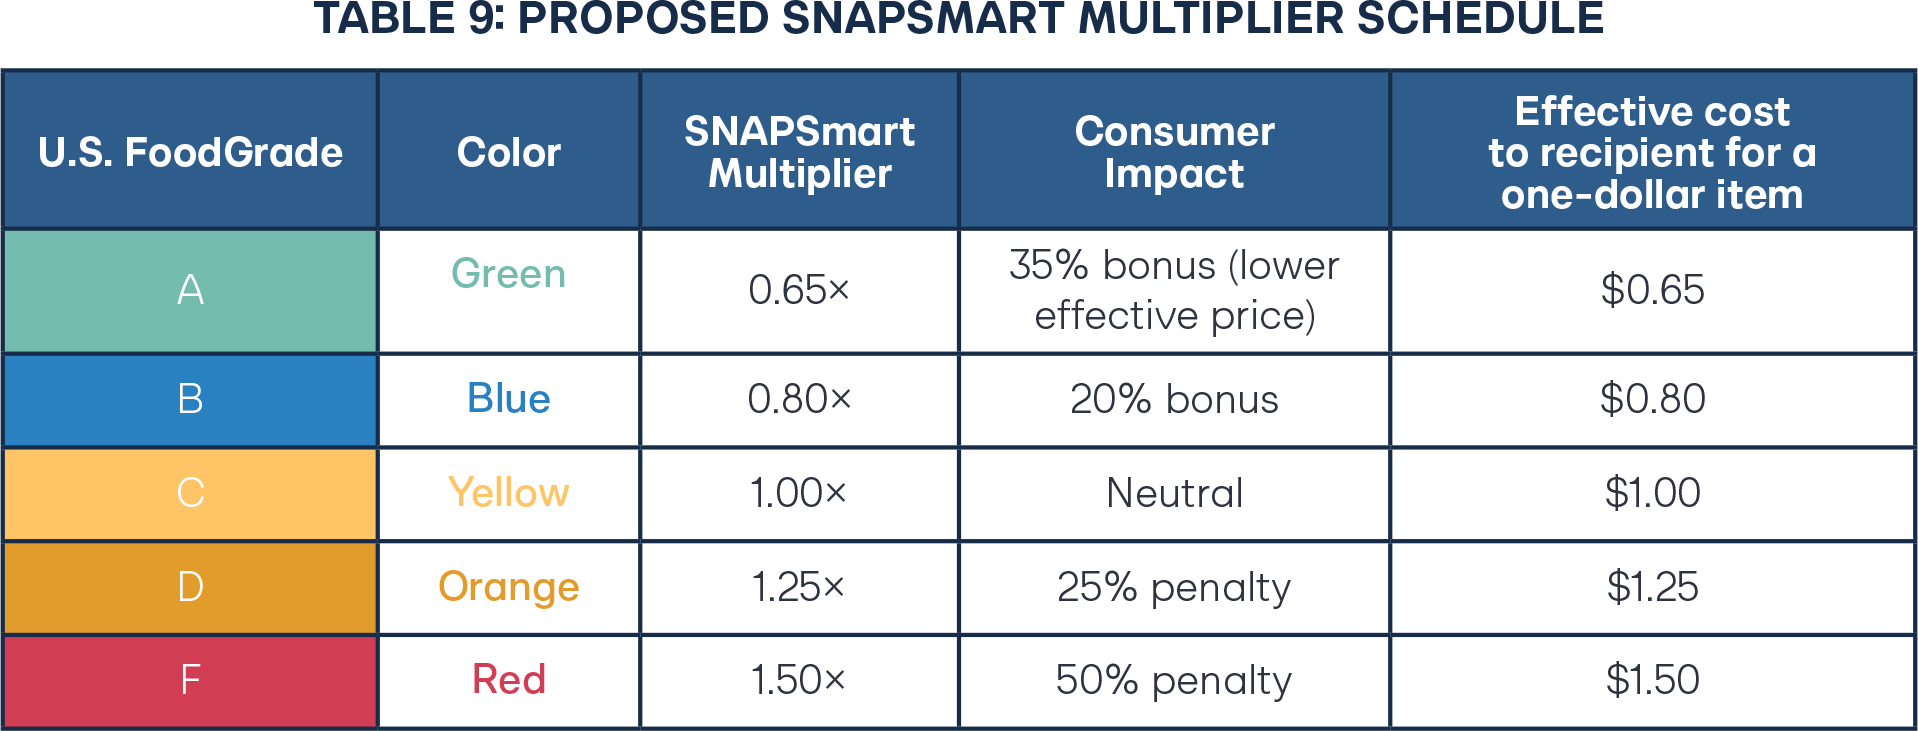
Multipliers can be designed to be budget-neutral on average by calibrating against observed baskets (e.g., a typical basket remains near 1.00× overall), while still producing meaningful item-level incentives.
Implementation Options for SNAPSmart
For the implementation of SNAPSmart, three strong pathways exist:
- USDA pilot/waiver. Start with online grocery transactions and a limited set of participating retailers; evaluate changes in basket quality and redemption patterns.
- Congressional authorization. Update SNAP statute to allow quality-tiered purchasing power tied to a standardized FOP grade. This works best if the FDA adopts the U.S. Food Grade framework.
- Phased rollout. Begin with bonuses only (grades A/B), then introduce penalties (grades D/F) after consumer acclimation and strong evidence of positive substitution effects.
Safeguards
The program could maintain full choice, ensuring that all or most foods are not prohibited. Incentives should be paired with retailer participation requirements that expand access to A/B options in underserved areas. It is also important to monitor unintended consequences, such as higher out-of-pocket spending, retailer price responses, substitution to equally low-quality but cheaper items, and impacts on recipients in food deserts. Additionally, a clear appeal and correction process should be provided for manufacturers to dispute grades.
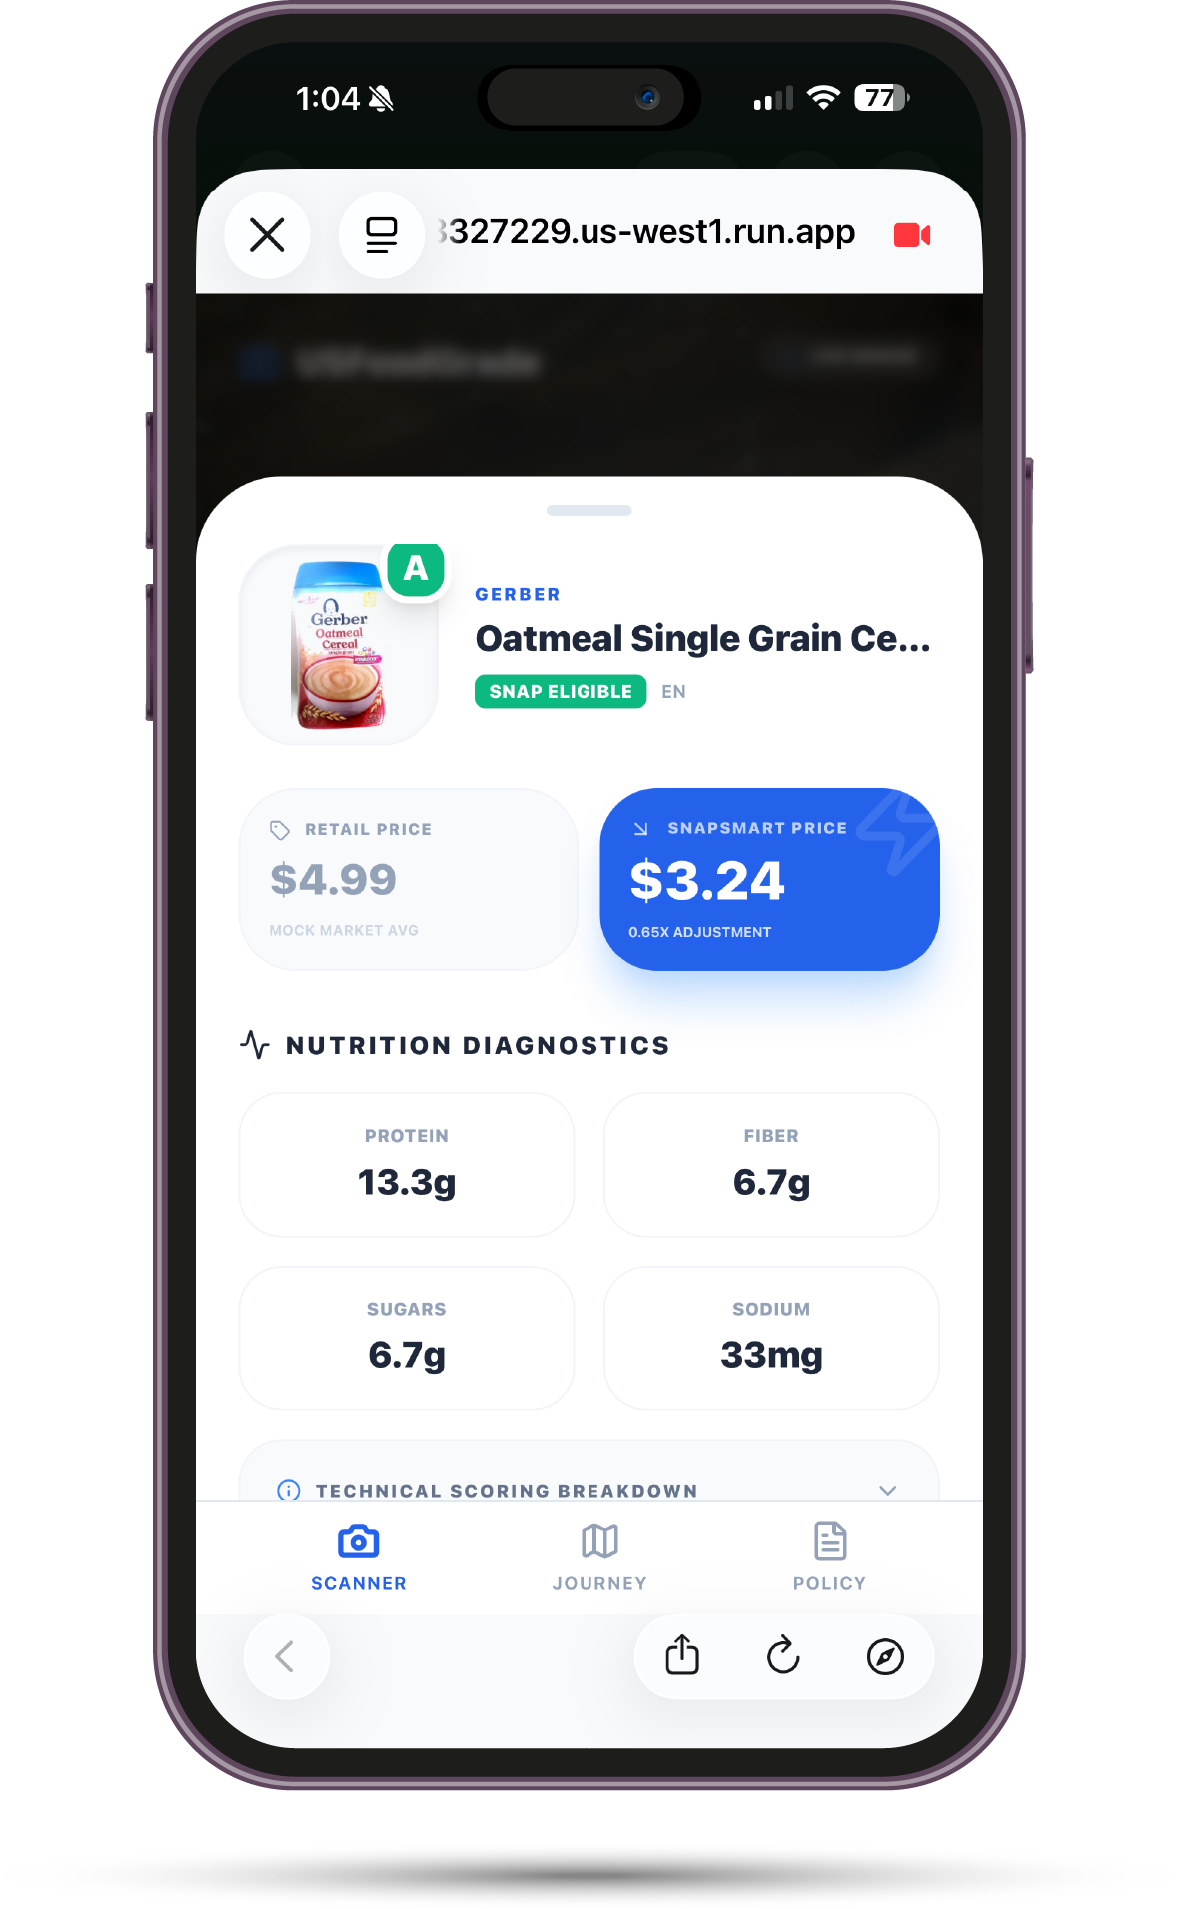
Prototype Policy Demonstration App
To make the policy tangible and implementation-ready, we built a demo application that simulates an online grocery shopping experience. The prototype shows, for each item: the U.S. FoodGrade badge, the retail price, and the SNAP-adjusted effective price under SNAPSmart.
The app is designed to support three uses:
- Stakeholder communication. Demonstrate consumer experience to agencies, legislators,
and retailers. - Implementation planning. Validate data requirements (nutrition facts, ingredients/
processing classification) and UI placement. - Pilot evaluation. Enable rapid A/B testing of label display formats and incentive magnitudes
in a controlled environment.
Click here to access the app.
Conclusion
U.S. FoodGrade and SNAPSmart together create a practical, scalable pathway to improve diet quality without bans: a simple signal for all consumers and a smarter subsidy for those most at risk of diet-related disease. Over time, the goal is to translate successful pilots into a durable, federally adopted standard that can operate nationwide. The proposal is intentionally pilotable—starting online, generating evidence, calibrating incentives—before any broad federal mandate is needed. In a food system where ultra-processed options dominate, transparent information and aligned incentives are the most durable levers available.

Stay Informed
Sign up to receive updates about our fight for policies at the state level that restore liberty through transparency and accountability in American governance.