
A Standard for Fiscal Transparency in Government


Introduction
Fiscal transparency is a bedrock of democratic accountability. The International Monetary Fund (IMF) defines it as “openness toward the public at large about government structure and functions, fiscal policy intentions, public sector accounts, and projections,” a standard that enables citizens, investors, and policymakers alike to judge a government’s true fiscal position, assess the efficiency of its spending in terms of outcomes, and identify the long-term consequences of its budget choices.1 When the flow of public money is visible–down to individual contracts and line-item appropriations–taxpayers can verify that resources are used as intended, markets can price sovereign risk more accurately, and elected officials face meaningful discipline for waste and corruption. As the National Institute of Government Purchasing notes, “Public awareness and understanding of government practice ensures stability and confidence in governing systems,” which underscores transparency’s central role in preserving the strength and legitimacy of democratic institutions and protecting the public purse.2
Two decades after these principles were first codified, fiscal transparency in the United States remains partial and uneven. U.S. PIRG’s Following the Money series–most recently updated in 2018–helped spur the creation of state transparency portals and identified persistent fragmentation, inconsistent data standards, and limited statutory mandates.3 Yet its scoring framework remained high-level: it rewarded the existence of a portal and listed major checkbook items but did not consider whether the data were granular, machine-readable, or linked across systems in ways that enable causal analysis. This review shows that the shortcomings the series flagged persist and matter more than ever. In many states, core datasets such as contract awards, line-item expenditures, and vendor payment records are either missing altogether or locked behind PDFs and static charts that defeat bulk download, time-series construction, or entity matching. Without radically open, well-structured data, independent economists cannot trace dollars from appropriation to outcome, policy analysts cannot run quasi-experimental evaluations, and watchdogs cannot pinpoint waste or self-dealing. The result is a transparency gap that frustrates citizens, journalists, and legislators alike—and leaves billions in taxpayer funds effectively beyond systematic scrutiny.
Closing this gap is critical if states are to steward public dollars with integrity, efficiency, and democratic accountability. This report therefore proceeds in six parts: first, a focused literature review distills what scholars have learned about the fiscal, economic, and governance benefits of radical transparency; next, a methodological section explains the data‐collection and scoring framework used in this paper; this is followed by a summary of the main findings, map the statutory landscape, and evaluation of the design and performance of every state transparency portal, illustrating best practice through detailed case studies. Finally, states are ranked in a comparative scorecard and offer model statutory language and technical standards that legislators, controllers, and agency leaders can adopt to make their fiscal data truly fit for causal analysis and public oversight.
A Brief History of Fiscal Transparency in the U.S.
The modern drive for fiscal openness began in the 1960s, when Congress enshrined a public “right to know” through the Freedom of Information Act.4 Within a decade, every state adopted its own public-records and “sunshine” laws, making budget documents, contracts, and agency files presumptively open. Congress reinforced the norm with the Government in the Sunshine Act (1976), requiring multi-member federal bodies to deliberate in public.5 To standardize and clarify governments’ financial reporting, the Governmental Accounting Standards Board (GASB) was established in 1984, issuing Generally Accepted Accounting Principles (GAAP) for states and localities. At the same time, the Government Finance Officers Association (GFOA) launched award programs that rewarded exemplary transparency in budgeting and reporting. By the late 1980s, nearly all states were publishing Comprehensive Annual Financial Reports (CAFRs) that detailed revenues, expenditures, debts, and assets in line with GAAP, bringing an unprecedented level of fiscal information into the public domain.
The 1990s brought a new wave of federal initiatives that raised the bar for fiscal transparency and set clear benchmarks for states to emulate. The Chief Financial Officers Act of 1990 mandated that the 24 largest federal agencies produce annual, independently audited financial statements, marrying public disclosure with professional assurance.6 Three years later, the Government Performance and Results Act (GPRA) required every agency to craft multi-year strategic plans, publish annual performance plans, and report measurable outcomes—linking dollars spent to results achieved.7 As the decade unfolded and the internet became mainstream, federal and state agencies began releasing budgets, audits, and performance data online, ushering in the first era of digital transparency and expanding public access well beyond the traditional print reports of earlier decades.
The internet era inured fiscal openness in the 2000s, as states began building interactive “open checkbook” portals that let anyone trace dollars with a few keystrokes. Momentum came from Washington: the bipartisan Federal Funding Accountability and Transparency Act of 2006 required every federal grant and contract to be posted on USAspending.gov, which showed that large-scale disclosure was technically and politically viable.8 Spurred by that example, more than a dozen states passed laws or issued executive orders in 2007–08 to publish line-item spending online. Texas led the charge with its Where the Money Goes site (launched October 2007), a free and searchable database of every state-agency payment.9 These early adopters demonstrated that comprehensive, user-friendly spending portals could be built quickly, operated cheaply, and win broad public support.
The Great Recession, which started at the end of 2007, pushed transparency from aspiration to statutory mandate. The $787 billion American Recovery and Reinvestment Act of 2009 (ARRA) required every recipient of stimulus funding—federal, state, local, contractor, or sub-grantee—to report project-level data on dollars spent, jobs created, and milestones achieved.10 Recovery.gov published those feeds in near-real time, giving the public an unprecedented cradle-to-grave view of stimulus funds. Seeking to entrench that model across all federal spending, Congress enacted the Digital Accountability and Transparency (DATA) Act of 2014, which ordered government-wide data standards and a single open platform for financial reporting.11 The U.S. Treasury and Office of Management and Budget unveiled the first common data elements in 2015, and by mid-2018, agencies were tagging each transaction with uniform award, account, and program codes, which made it theoretically possible to trace a dollar from appropriation to outcome. The Government Accountability Office has flagged lingering accuracy gaps, but the architecture for full-cycle fiscal transparency now exists, providing a roadmap for states to follow and improve upon.
Throughout the 2010s, states not only finished rolling out transparency portals but steadily widened their scope: adding quasi-public agencies, off-budget funds, tax-expenditure reports, and even municipal spending feeds to what had begun as simple “checkbook” sites. U.S. PIRG’s Following the Money 2015 survey documented broad, year-over-year gains in data completeness and usability.12 Crucially, these advances proved neither expensive nor partisan: most states built or upgraded their systems for well under a few hundred thousand dollars and recouped costs over time by streamlining records requests and boosting internal efficiency.
Key fiscal information—from initial appropriation through audit findings and post-contract evaluations—should not merely be public but published promptly in machine-readable formats that invite independent scrutiny. When data are searchable, downloadable, and up to date, oversight scales: journalists, watchdogs, and academic researchers can pinpoint waste, flag fraud risks, and benchmark program performance in real time, giving taxpayers a transparent, dollar-by-dollar account of how their money is managed.
Despite persistent technical hurdles and occasional gaps between statutory ambition and day-to-day practice, the past half-century leaves little doubt: fiscal transparency is now a settled expectation of American governance. Taxpayer money must be publicly visible—an imperative that shapes modern budget law, data infrastructure, and democratic accountability alike.

Academic Research on Fiscal Transparency
Substantial research literature exists examining fiscal transparency: what it entails, what drives it, and how it affects governance and economic outcomes. The review that follows synthesizes peer-reviewed studies alongside major reports from think tanks and oversight bodies. The weight of evidence links higher transparency to stronger fiscal discipline, lower borrowing costs, and reduced corruption, with ancillary gains in public trust and civic participation. Crucially, these benefits are largest when disclosure is timely, standardized, machine-readable, and enforceable. Those are the conditions that enable economists to trace dollars from appropriation to outcomes and to identify causal effects rather than correlations. This review distills these findings and draws out state-level implications that inform the statutory and technical standards recommended in this white paper.
Definition
Fiscal transparency is commonly defined as the public’s ability to see and understand government finances. Practically, this means publishing budget plans and enacted appropriations, realized revenues and expenditures, debts and liabilities, and the assumptions underlying policy choices so that an informed observer can assess fiscal position and track results. This white paper adopts a research-grade standard that extends this definition by insisting on:
- Explicit linkages between appropriations and the legislative intent that governs them;
- Publication of benchmarks and realized performance tied to the dollars spent; and
- End-to-end openness in public procurement—solicitations, bids,awards, amendments, payments, and vendor performance.
These features are especially critical at the state level, where most public services are delivered and where causal evaluation hinges on granular, machine-readable data that connect appropriations to contracts and outcomes.
Metrics
Measuring fiscal transparency is inherently multi-dimensional. International frameworks, such as the International Budget Partnership’s Open Budget Survey, the IMF’s Fiscal Transparency Code, and the Organization for Economic Co-operation and Development’s best-practice guidance, converge on a core set of principles such as clearly assigned fiscal roles and responsibilities; public availability of key documents across the budget cycle; credible, timely reporting; and independent external scrutiny.13,14,15 These benchmarks define a baseline: transparency is not only about disclosure, but about disclosure that permits informed, outside evaluation—the ultimate purpose of making fiscal actions visible.
In the U.S. context, scholars have adapted these concepts to state and local institutions. Alt, Lassen, and Rose pioneered a quantitative index of state budget-process transparency built from surveys of state budget offices, which covered features such as GAAP adoption, revenue and expenditure forecasting practices, the clarity of legislative budget bills, the use of multi-year frameworks, and the integration of performance measures.16 They documented substantial cross-state variation and a general upward trend over the late twentieth century.17 Parallel efforts at the substate level constructed disclosure-based indices for local governments, reinforcing the value of standardized, comparable metrics for tracking progress over time.18
Because measurement follows purpose, indices differ in emphasis. The approach in this analysis centers transparency as inferential adequacy: the extent to which published fiscal data enable independent researchers to evaluate governance performance and, where feasible, identify causal effects. Concretely, this requires (i) explicit statutory authority and enforceable update requirements; (ii) end-to-end granularity from appropriation to contract to payment and audit; (iii) machine-readable, bulk-downloadable data (and APIs) with comprehensive metadata and data dictionaries; (iv) persistent, joinable identifiers that link appropriations, programs, contracts, vendors, payments, and outcome datasets; (v) coverage of quasi-public entities and off-budget funds; and (vi) procurement transparency spanning solicitations, bids, scoring, awards, amendments, and vendor performance. By privileging these features, the measure assesses not just whether information exists, but whether it is- structured and complete enough to let economists test alignment with legislative intent and evaluate results.
Determinants
States do not become transparent by accident. The academic literature points to a constellation of incentives, institutions, and infrastructure that together determine how much fiscal information governments reveal and how usable that information is. These determinants matter for the purposes of this paper because they explain why transparency varies so widely across states—and, crucially, because many of them are policy-malleable. If this research can identify which levers move the needle (and under what conditions), it can recommend statutory and technical fixes that reliably raise transparency to a research-grade standard.
On incentives, Alt, Lassen, and Rose (2006) show that states with tighter electoral competition and greater power sharing tend to be more transparent.19 The mechanism is straightforward: when office turnover is plausible and the opposition has leverage, incumbents gain from committing to disclosure that builds credibility with voters and markets. By contrast, entrenched single-party control lowers the marginal payoff to revealing information. Transparency can also serve as a commitment device in uncertain environments—incumbents anticipating defeat may hard-wire disclosure to constrain successors or to signal probity. Economic exposure sharpens these incentives: fiscal stress, reliance on bond markets and credit ratings, and federal grant regimes with reporting lineages (e.g., ARRA → DATA Act) all increase the value of timely, credible data.
On institutions, constitutions, statutes, and standards can hard-wire openness. GAAP-based budgeting, strict open-meetings and public-records laws with enforceable timelines, independent auditors/controllers, balanced-budget rules, and procurement codes that document the full contract life cycle all push toward clearer, verifiable accounts. Explicit legal mandates for transparency portals—defining scope, update frequency, formats, retention, and enforcement—matter: the 2007–08 wave of “open checkbook” laws and executive orders (discussed above) catalyzed durable portal creation and upgrades.
On infrastructure, technology converts intent into usable transparency. Professionalized budgeting and data governance, adequate IT capacity, adoption of open data standards and APIs, and the use of persistent, joinable identifiers (linking appropriations → programs → contracts → vendors → payments → audits) make disclosure both feasible and analytically valuable. Where states align ERP systems with open-data pipelines, publish bulk downloads with data dictionaries and versioning, and (for procurement) consider standards like OCDS, external users can run rigorous, quasi-experimental evaluations. Without this capacity, agencies default to PDFs and dashboards that look transparent but resist analysis. In practice, durable gains come from complementarity: incentives × institutions × infrastructure.
Impacts
No less important than the drivers are the consequences. Economic research treats transparency not as an abstract virtue but as a measurable input to governance, with documented effects on budget balance and expenditure composition, debt and borrowing costs, corruption and procurement integrity, and citizen trust and participation. This research synthesizes these findings then highlights the conditions under which transparency improves allocative efficiency and accountability.
- Transparent governments tend to have better fiscal performance: lower debts and deficits over time, and more prudent budgeting. Bearing this out, Benito and Bastida (2007, 2009) found that Spanish regions with higher transparency had lower primary deficits.20-21 Cross-country studies likewise found that governments with more transparent budget procedures accumulated less debt and were less likely to run large deficits.22
- Transparency curtails creative or off-budget accounting tricks. Opaque systems allow governments to shift expenditures off-budget, underreport debt, accumulate arrears, or optimistically forecast to mask deficits. Heald (2003) and Bastido andBenito (2009) support this impact by pointing to how the European debt crisis revealed hidden liabilities in countries with less transparency.23–24
- Investors likewise perceive less risk of unknown liabilities when better informed about a government’s finances, which lowers interest rates on government bonds. IMF studies by Hameed (2005) and more recent work by Arbatli and Escolano (2015) find that countries with higher fiscal transparency scores enjoy better credit ratings and pay lower spreads on their debt.25–26 Likewise, Glennerster and Shin (2008) showed that when countries adopted the IMF’s fiscal transparency standards, their bond yields fell relative to less transparent peers.27 Summarizing the impact on U.S. states, a Brookings Institute publication observed that states may borrow money more easily after making their assets and liabilities more accessible.28 Recognizing this, organizations like the Open Government Partnership advocate debt transparency since it “reduces the cost of borrowing” for governments.
- Fiscal transparency reduces the opportunities for corruption, waste, and misuse of funds. A cross-country analysis by Benito and Bastido (2009) and Khagram et al. (2013) suggests that improved accountability measures, which rely on a degree of transparency, reduce government corruption.29–30
- Evidence also supports the less tangible impact that transparency increases public trust and civic engagement. Alt and Lowry (2010) observe that transparency mitigates the public backlash from necessary but unpopular policies.31 Specifically, in U.S. states with higher budget transparency, politicians who enacted tax increases were less likely to be punished at the polls. Kosack and Fung (2014) note that citizens with more information are more likely to discuss budgets, provide feedback, or even co-create solutions.32 Benito and Bastida (2009), similarly, find evidence that transparency initiatives correlate with more public interest in budget issues.33
While existing studies point to meaningful benefits from transparency, most stop short of evaluating what this paper refers to as end-to-end transparency—datasets that let citizens and researchers trace dollars from appropriation to contract to payment to audited outcomes. Such radical openness is democratizing because it removes privileged gatekeeping over public data and enables reproducible analysis. At the same time, the evidence on causal effects of transparency initiatives remains limited: many findings rest on cross-sectional indices or self-reported practices, and relatively few studies leverage exogenous policy shocks (e.g., portal mandates, FOIA expansions, ARRA/DATA Act reporting rules) with quasi-experimental designs. Building research-grade portals would not only improve governance; it would also unlock a fertile research agenda—using staggered adoption designs, event studies, synthetic controls, regression discontinuities around
procurement thresholds, and randomized disclosure pilots—to quantify where transparency yields the largest returns.
Conditions
Despite well-documented benefits, transparency is not self-executing; its impact hinges on intelligibility, sustained resourcing, and an enabling civic ecosystem. First, published data are not thereby understood. Heald (2003) highlights the “level-of-abstraction” problem: large volumes of technical fiscal data can obscure rather than illuminate.34 Without plain-language documentation, data dictionaries, and clear schemas, disclosure risks becoming nominal. Second, under-investment erodes credibility. As Bertot et al. (2010) note, portals that lack maintenance budgets, update schedules, versioning, and basic quality assurance quickly grow stale or unusable.35 Third, more data can amplify misunderstanding or strategic cherry-picking by bad-faith actors; provenance metadata, contextual denominators (e.g., per-capita, per-contract), and prominent caveats help counter skewed narratives. Finally, effectiveness depends on institutions: enforceable open-records laws, independent audit, a free press, and an active civil society increase the likelihood that public data are used to hold government to account rather than to mislead. Sound policy should therefore pair disclosure mandates with usability standards, recurring funding, and institutional safeguards.
Garrett and Vermeule (2006) and Rose and Smith (2011) caution that transparency can disproportionately benefit well-organized interests: lobbyists and trade groups possess the time, expertise, and tools to parse complex datasets, while ordinary citizens face severe attention and capacity constraints.36–37 This risk is real, but not determinative. Transparency also arms countervailing actors—journalists, watchdog NGOs, taxpayer associations, and rival coalitions—lowering their costs of coordination and enabling pluralistic scrutiny. The design implication is to engineer symmetry: simultaneous public release (no privileged pre-access), machine-readable bulk data with dictionaries and APIs, plain-language summaries
and visualizations for lay users, and support for civic intermediaries (e.g., universities, libraries, public-interest data labs). Where such guardrails and capacities exist, transparency is less likely to entrench capture and more likely to broaden accountability.
The caveats above counsel better design, not retreat. What’s needed is sustainable
transparency—clear statutory mandates, recurring funding, and enforceable accountability—paired with usability standards that make disclosure work in practice. As Meijer (2013) argues, the goal is not “more transparency” in the abstract but transparency of what, for whom, and to what end.38 Fiscal information should be relevant to real decisions, accessible in searchable, machine-readable formats, and actionable for citizens, journalists, legislators, and researchers—linkable from appropriation to contract to outcome and accompanied by documentation that enables independent analysis.
Methodology
This study conducted a systematic desk review of official, publicly available materials across U.S. states—including statutes and administrative codes, executive orders, transparency portals and data catalogs, and controller/treasurer websites—to identify and evaluate core transparency mechanisms. The assessment considered both existence and implementation quality along three dimensions:
- Statutory authority and specificity;
- Data coverage and completeness across the budget cycle (appropriations,contracts, payments, audits, and performance); and
- Analytical usability and public accessibility (searchability, machine-readable formats, bulk downloads/APIs, metadata and documentation, and basic accessibility features).
- It also recorded whether portals appear explicitly authorized by statute or operate without clear statutory backing. All evaluations rely solely on information publicly accessible as of August 2025.
States were scored on an 89-point rubric spanning eight domains: Core Portal; Payments; Payroll; Contracts; Integration and Budget; Usability; Quality and Audit; and Legal Framework. Unless noted, criteria award full points with no partial credit; limited partial credit applies where specified (e.g., two out of a possible four points for constrained bulk downloads; one out of a possible two points for partial contract-document publication; one out of a possible three points for minimal documentation). This weighting prioritizes analytical utility and statutory durability—rewarding joinable, research-grade data and clear legal obligations—so that transparency extends beyond appearance to verifiable, end-to-end fiscal traceability.
In states with multiple contract-related sites, portals explicitly designed for public transparency were prioritized over transactional procurement systems (e.g., vendor registration/bidding). Features were credited only if available via unauthenticated public access. Where transparency functionality was split across more than one official portal, this analysis treated them as a combined offering—aggregating complementary features to reflect the best publicly achievable configuration while deduplicating overlapping capabilities.
In borderline cases—e.g., when a search tool existed but did not reliably return results, or when documentation was present but incomplete—this study assigned partial credit only where a feature was technically available yet materially limited. To keep scoring fair and consistent, it applied a uniform decision rule across states: credit the minimum functionality demonstrably usable by the public at the time of review, and discount features that were intermittent, gated, or non-operational. The report recorded these judgments in the notes to preserve transparency about how individual criteria were applied while remaining faithful to the spirit of the rubric.
For criteria tied to recency or history (payments/contracts within the past month, five years, or 10 years), datasets without explicit temporal fields (e.g., per-record date, posting date, or contract start/end year) were scored 0 on those items. Portal-level “last updated” banners, undated PDFs, or filename hints did not qualify. This rule makes temporal specificity a strict prerequisite for judging timeliness and historical depth and ensures that longitudinal analysis is actually feasible.
Main Findings
The 50-state review in this analysis shows a wide distribution of total scores—and recurring fault lines. A small group of states comes close to achieving research-grade transparency, a larger middle offers basic visibility with important gaps, and a long tail delivers little beyond nominal “open data.” The most common shortfalls are not whether a portal exists, but whether it is complete, usable, and linkable: many sites omit contract text or spend-to-date fields, lack bulk downloads or APIs, and fail to provide joinable identifiers that connect appropriations → contracts → payments → outcomes. Equally, legal scaffolding is uneven. Numerous portals operate without clear statutory mandates, update requirements, or enforcement, leaving access contingent on administrative goodwill. In short, transparency often favors form over function—dashboards over data—limiting independent analysis and accountability.
Only a small cluster of states performs well across payments, payroll, contracts, integration, usability, data quality, and legal framework. Many still lack one or more foundational pieces—a statewide core portal; a checkbook with bulk, multi-year history; a contracts database with award amounts, amendments, and contract PDFs; joinable identifiers; or clear statutory mandates and update requirements. The result is transparency that too often looks presentational but is analytically useless. Citizens and researchers cannot trace dollars end-to-end, and oversight devolves to ad hoc records requests. These patterns reflect systemic issues—fragmented ownership, weak standards, and limited enforcement—rather than technical impossibility. Without enforceable statutes, persistent identifiers, and research-grade data pipelines, state transparency will remain uneven and, in many cases, nominal.
Core Portal
A core portal should function as the canonical entry point for fiscal data—linking (and ideally joining) contracts, payments, and payroll. It should provide stable URLs, bulk downloads/APIs, and data dictionaries while covering all statewide entities (including quasi-public bodies). States that scatter content across agency sites or rely on procurement systems alone sacrifice discoverability, consistency, and analytic usefulness.
In this review, 49 of 50 states maintained some form of public transparency site; Hawaii was the lone exception without a general-purpose transparency portal. Although Hawaii operates a contracts database, it is primarily a procurement-facing system—built for vendors and transaction processing rather than public accountability. Under the minimum standard in this analysis, meaningful transparency requires three public, unauthenticated portals or databases:
- Contracts;
- Vendor payments (checkbook); and
- Payroll/compensation
By this threshold, 17 states were missing at least one pillar, and four offered only a single portal. This absence leaves large blind spots in how dollars are awarded, disbursed, and paid to personnel.
Payments Portal
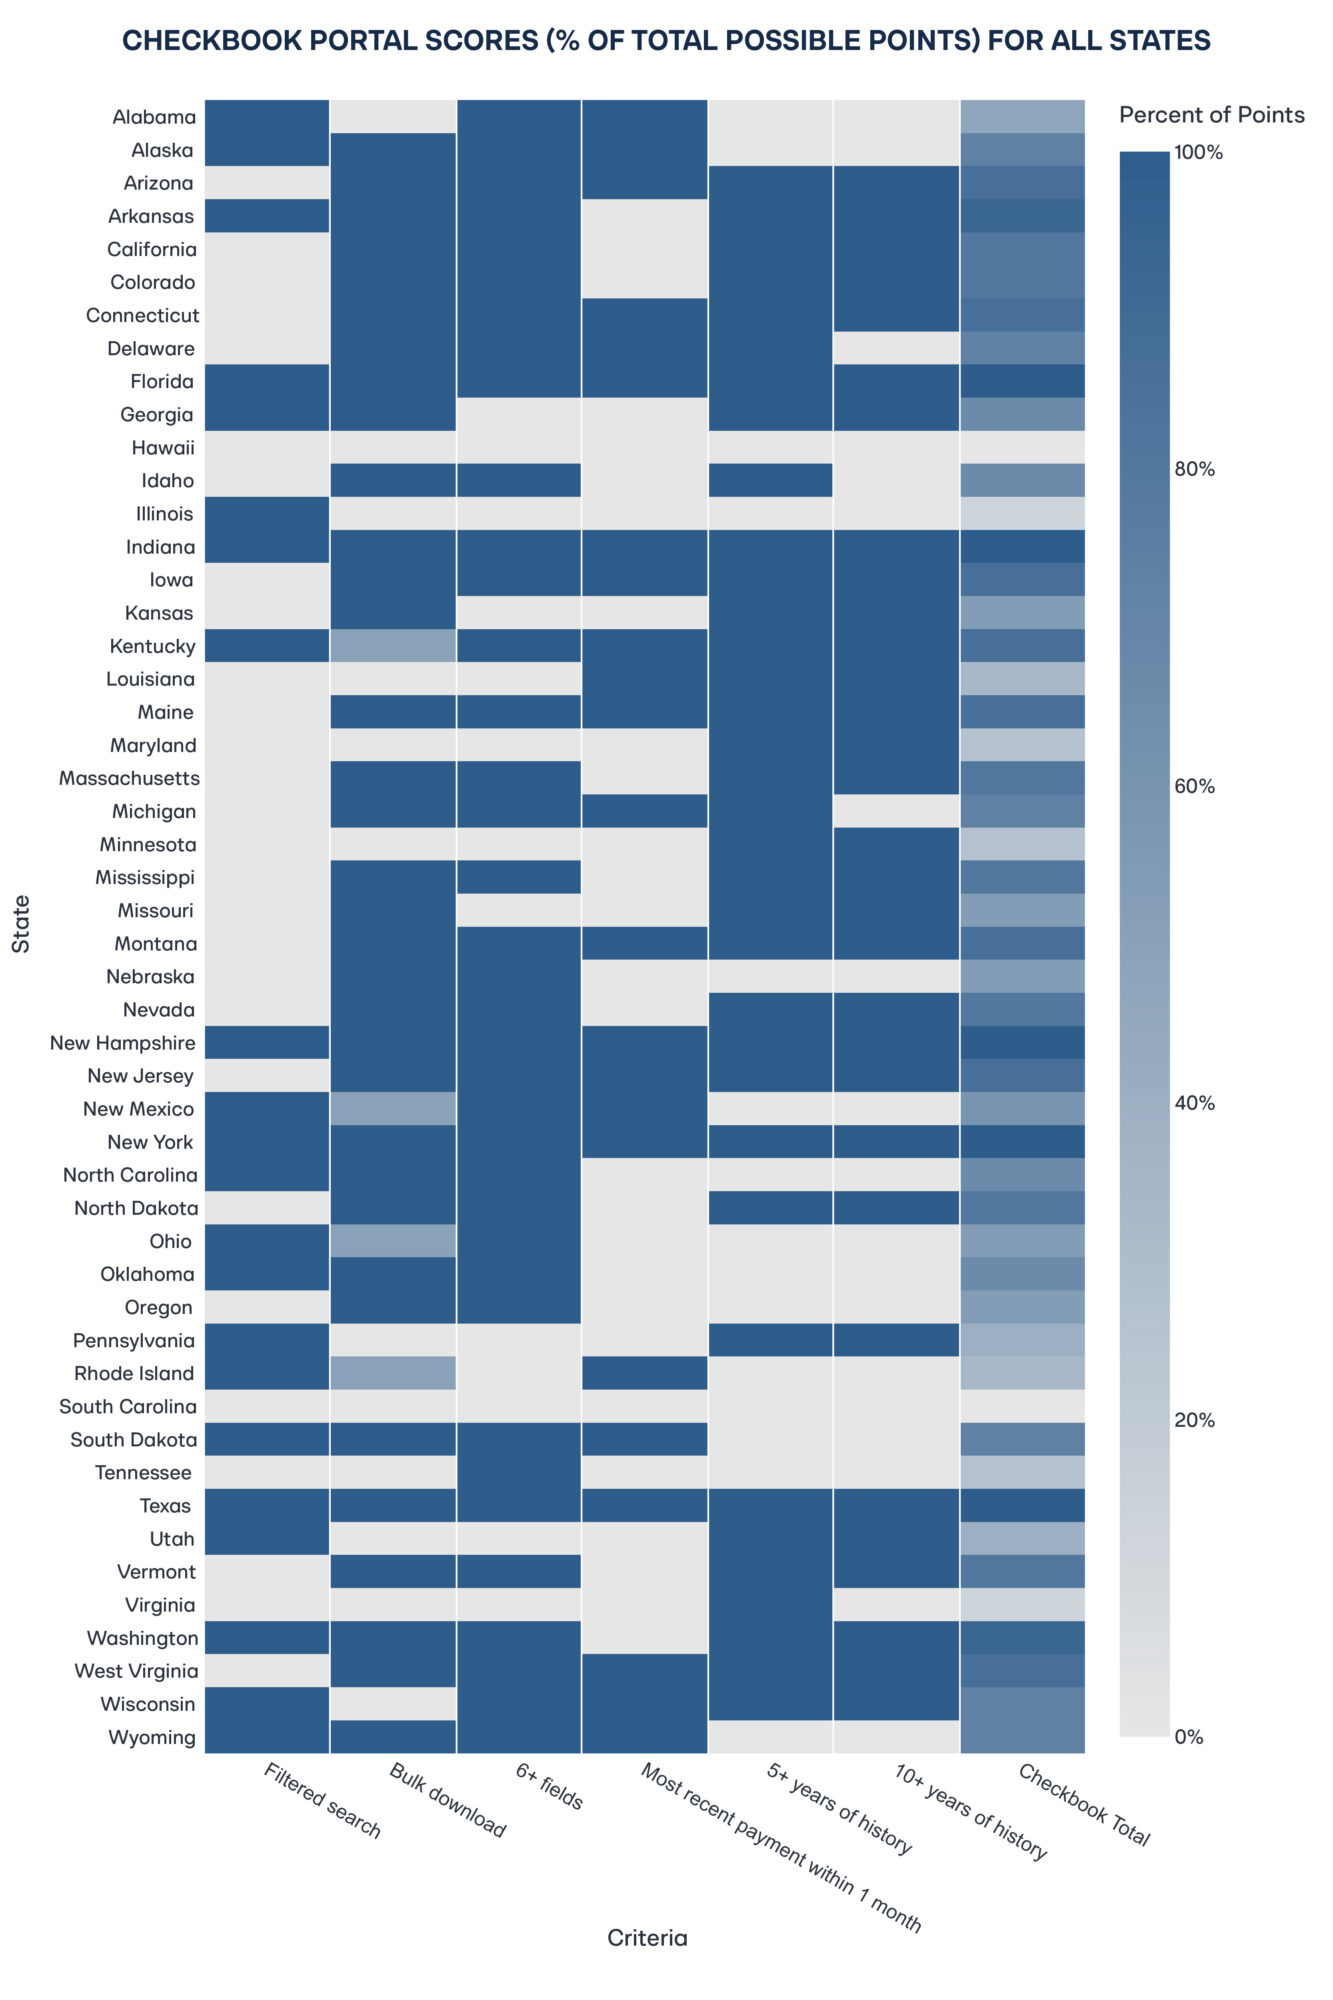
The payments portal is the state’s public checkbook (the atomic, transaction-level record of dollars actually disbursed), and it anchors any end-to-end audit of spending. This report therefore assesses it on six features:
- Filtered search (by date, agency, vendor, amount, keyword)
- Bulk download at least at annual granularity
- More than six data fields per payment (e.g., date, agency, vendor, amount, purpose, category)
- Evidence of recency (more than one payment within the past 30 days)
- Longitudinal coverage with at least five and 10 years of history.
These thresholds ensure that spending data are not merely posted but detailed, current, and reusable, which supports time-series analysis, vendor-level profiling, and, where merge keys exist, linkage to contracts and appropriations.
Five states (Florida, Indiana, New Hampshire, New York, and Texas) earned the maximum 15 out of 15 points for this category. But full marks were the exception, not the rule. 28 of 50 states (56 percent) lack any filtered search, which hinders isolating transactions by vendor, agency, date range, or amount. Eleven states (22 percent) offer no bulk download, effectively blocking large-scale analysis, replication, or audit sampling. And in 13 states (26 percent), entries contain fewer than six fields, which leaves too little context (e.g., purpose, category, or program) to interpret what a payment actually funds. These gaps convert “posted” data into unusable data and prevent end-to-end tracing from appropriations to outcomes–precisely what research-grade transparency requires.
There are some bright spots: 23 states (46 percent) showed at least one transaction in the past 30 days, which suggests reasonably current feeds. But recency without continuity is not enough. Fifteen states (30 percent) lacked a record that went back more than five years, and 19 (38 percent) did not offer more than 10 years of payment data. Thin history weakens transparency, blocks long-run trend analysis, and obscures vendor and program performance across budget cycles and administrations. Research-grade transparency requires both freshness and span: regular updates, record-level dates (payment vs. posting), stable field definitions across years, and basic archival/versioning so users can reconstruct the ledger over time.
Payroll Portal
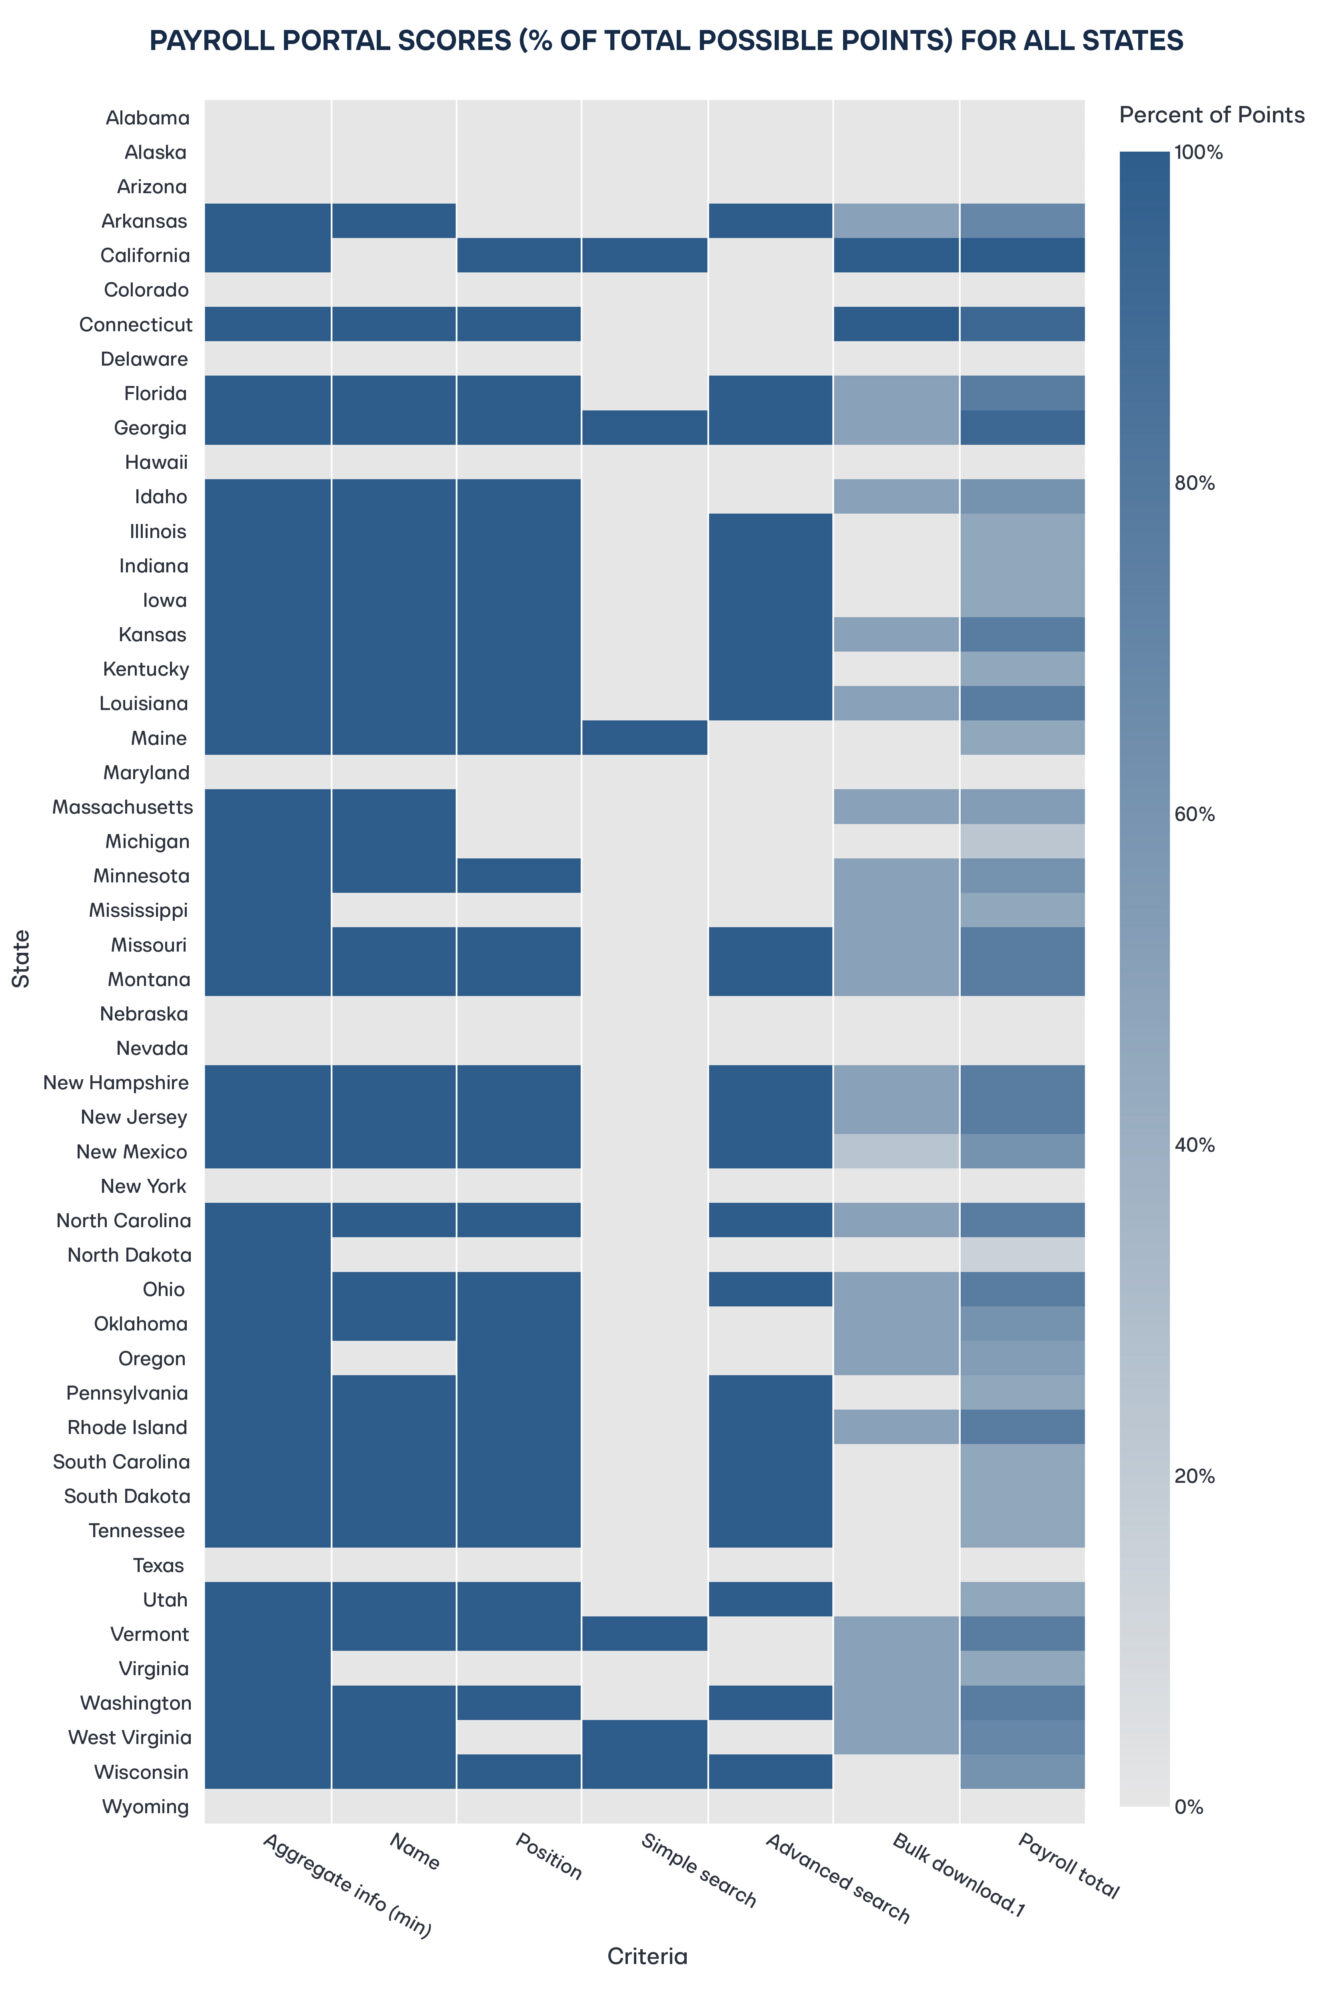
Employee compensation is one of the largest and most politically salient components of state spending. A public payroll portal enables taxpayers to see how workforce dollars are allocated across agencies and roles, supports analyses of overtime and supplemental pay, deters ghost positions, and informs debates about pay equity and staffing, while operating under appropriate privacy safeguards (e.g., exemptions for protected or undercover roles). This analysis evaluated payroll portals on six criteria:
- Availability of at least aggregate salary data;
- Inclusion of employee names;
- Inclusion of position titles;
- A simple, global search;
- Advanced filters (e.g., name, department, position); and
- Bulk download for analysis
These thresholds capture both the completeness of compensation reporting and the ease with which the public can access and reuse the data.
Only two states (Connecticut and Georgia) earned a perfect six out of a possible six points (four percent). At the other end, 12 states (24 percent) provide no standalone payroll portal, which leaves compensation data buried in general expenditure reports. Among states that do publish payroll data, key elements are frequently missing: five states (10 percent) omit employee names, seven (14 percent) exclude position titles, nine (18 percent) offer no search of any kind, and 13 (26 percent) lack bulk download. Where legitimate privacy concerns exist (e.g., protected or undercover roles), precision redaction or pseudonymous unique IDs can preserve safety without eliminating transparency wholesale. As it stands, these gaps impede workforce analytics (e.g., overtime, pay equity, vacancy tracking) and blunt public oversight of one of the largest categories of state spending.
Contracts Portal
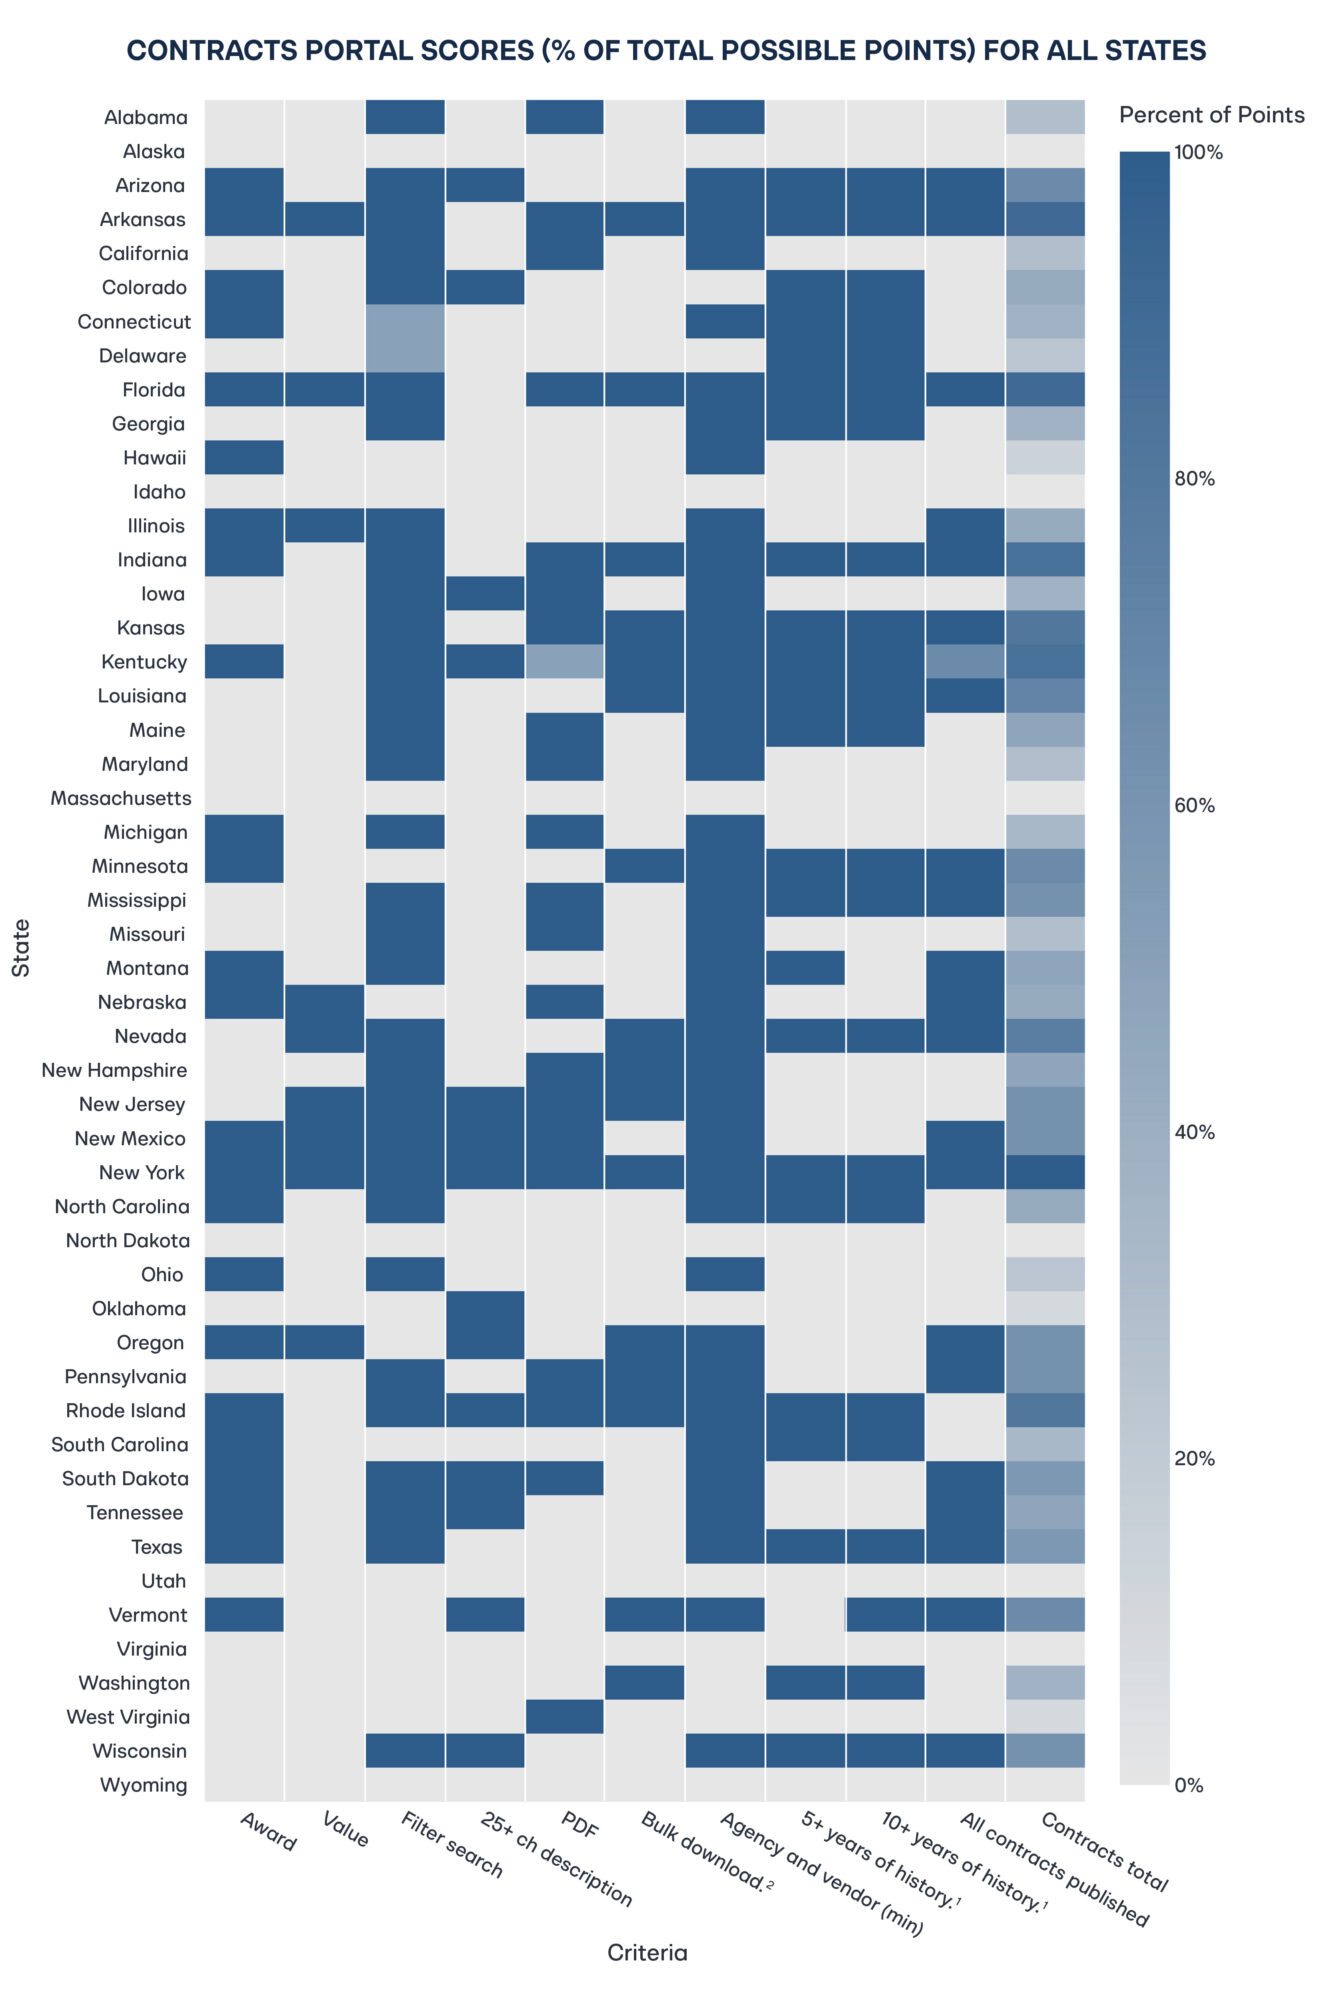
Contract data is the linchpin of financial oversight. It reveals how governments buy, from whom, on what terms, and with what performance. This evaluation therefore covered the full contract lifecycle and the features that make it auditable and analyzable: search and filters; presence of award amounts and spend-to-date; meaningful descriptions; publication of contract documents (PDFs); bulk download/export; required agency and vendor fields; historical depth (more than five and more than 10 years); and coverage of all contract types without monetary thresholds. Together, these elements enable market and integrity checks (competition, pricing, vendor concentration), linkages to payments and appropriations, and credible assessments of whether spending aligns with legislative intent.
New York was the only state to earn a perfect 21 out of a possible 21 points (two percent of all states) on the contracts rubric. At the other end, seven states (14 percent) received no points as they lacked any public contracts portal. Virginia also scored zero: although some contract information is technically online, it fails the minimum transparency thresholds—there is no statewide, public-facing portal with robust search and filters, bulk export, meaningful field coverage (award and spend-to-date), or consistent historical depth. This gap illustrates a broader pattern: transactional procurement systems aimed at vendors are not substitutes for purpose-built transparency portals designed for public oversight.
Even where a contracts portal exists, the lifecycle view is often missing. Only seven of 50 states (14 percent) disclose both the award amount and spend-to-date—the basic numerator and denominator for assessing burn rate, amendments, and vendor performance. Nine states (18 percent) offer no filtered search; 21 (42 percent) fail to publish the underlying contract documents (PDFs); 27 (54 percent) provide no bulk download; and 20 (40 percent) lack history going back more than five years. In 21 states (42 percent), not all contracts are published—coverage is limited to high-value or master agreements—obscuring the “long tail” of smaller procurements that cumulatively matter and carry risk. The result is presentational transparency without analytical transparency: users can see that contracts exist but cannot reliably audit terms, trace spending, or evaluate performance.
Integration and Budget
Because meaningful oversight requires tracing dollars from appropriation → contract → payment, this analysis evaluated whether portals expose field-level links back to the budget. It scored three items:
- A merge key that reliably links payments and contracts (e.g., award/contract number, PO, voucher/transaction ID);
- Explicit appropriation/funding fields that tie each record to legislative allocations (fund, program, appropriation year or code); and
- A strategy/program code (where states use goal–objective–strategy structures or equivalents) enabling roll-ups from transactions to budgeted strategies or funding sources.
These integration features convert disclosure into analysis—making it possible to test alignment with legislative intent rather than merely viewing transactions in isolation.
Only five states—Florida, Illinois, Nebraska, New York, and Wisconsin—(10 percent of all states) expose a stable, joinable merge key that lets users link spending records to budget line items. No state publishes appropriation-level fields at the transaction/contract level or a program/strategy coding schema (or equivalent framework) that explains how the portal maps to the budget structure. Without these links, the public checkbook is effectively decoupled from the budget law. As such, researchers cannot test alignment with legislative intent, build program-level time series, or reconcile spend-to-date with appropriations—undercutting the core purpose of transparency.
Usability
Transparency only works if people can understand and use the data. This analysis therefore checked whether states provide the baseline supports that turn disclosure into analysis:
- Documentation/data dictionaries that explain how datasets are assembled and define every field;
- Clearly posted terms of use that specify rights to access, reuse, and cite the data; and
- An open API for programmatic access.
Together, these elements reduce the learning curve for journalists, researchers, and civic technologists and make replication and tool-building feasible.
Only two states—Florida and Indiana—(4 percent) provide any documentation to help users interpret fields or understand how datasets are assembled. Arizona, Florida, and Utah post terms of use, but these are largely legal disclaimers rather than user-oriented guidance on rights to reuse and cite. Most strikingly, Vermont is the only state offering an open API for programmatic access. The result is data that are technically “public” but hard to analyze at scale. Without data dictionaries, provenance or update notes (or APIs), researchers must guess at field meanings or scrape pages and cannot easily reproduce results. A minimum usability standard should include plain-language documentation, field-level definitions, version/change logs, and API endpoints with example queries.
The widespread absence of documentation, clear terms, and APIs suggests many portals are built for compliance rather than accessibility or civic use. Without data dictionaries, provenance or update notes, and programmatic access, data that is technically open is effectively closed. The fixed costs of analysis remain high, scraping is brittle, results are hard to reproduce, and public engagement is confined to specialists. It is recommended, therefore, that usability is treated as a first-order requirement, not an optional enhancement.
Quality and Audit
This analysis evaluated whether portals make the data’s provenance and verification explicit. In particular, it looked for:
- Methodology notes that document sources, ETL/ingestion steps, update frequency, inclusion/exclusion rules, field definitions, and known limitations; and
- An audit hash within the payments and contracts portals (i.e., visible integrity signals such as links to auditor reports, validation summaries, change logs, per-file checksums or version IDs, and time-stamped revision histories).
These disclosures let users assess fitness for purpose, reproduce analyses, and detect retroactive edits.
Only four states—New Jersey, New York, Oregon, and Vermont—(8 percent) publish public methodology notes that explain how portal data are sourced, processed, and updated. By contrast, just one state (Florida) embeds audit signals directly in its portals, allowing users to see whether and how specific payments or contracts have been audited. Elsewhere, provenance and verification are largely opaque, which leaves users unable to assess data fitness, trace revisions, or reproduce results with confidence.
Legal Framework
No state reached the maximum 25 out of a possible 25 points on the legal rubric determined for this research. Two systemic gaps explain the shortfall. First, enforcement is absent. While many states mandate portals or disclosure by statute or executive order, no state provides penalties, remedies, or other formal accountability for non-compliance. Second, documentation is not required: no state explicitly mandates the publication of data dictionaries, methodology notes, or user guidance to make disclosures interpretable. These omissions weaken both the legal guarantee (rules without teeth) and the practical guarantee (data without instructions), which exposes transparency to administrative caprice rather than being assured by law.
This analysis assessed each state’s statutory architecture against eight elements:
- Any legal clause referencing transparency;
- An explicit mandate for a statewide portal;
- Specific lists of required data items;
- An expansive inventory covering multiple data types (payments, contracts, payroll, budget, revenue, and assets);
- A requirement to publish in open formats;
- A requirement for machine-readable data;
- A mandate to publish documentation (e.g., data dictionaries, methodology notes); and
- Enforcement mechanisms with consequences for non-compliance.
While many states earn points for a general legal basis or a portal mandate, comparatively few codify the technical and procedural “how”, which could include open and machine-readable formats, required documentation, and enforceable timelines and remedies. Absent these details, legal frameworks authorize visibility in principle but fall short of guaranteeing accountable and accessible transparency in practice.
Florida earned the highest score on this legal framework rubric with 20 out of a possible 25 points, incorporating most best practices, including an explicit portal mandate, detailed multi-dataset disclosure requirements, and requirements for open and machine-readable formats. Most states fell far short. Fourteen have neither a transparency clause nor a statutory portal mandate. Among states with some provision, 10 fail to specify which data categories must be disclosed, and 11 lack an expansive inventory across payments, contracts, payroll, budget, revenue, and assets. Florida is also the only state that expressly requires machine-readable publication. At the other end of the spectrum are states that scored 0 points: Alabama, Delaware, Hawaii, Maine, Michigan, Montana, New Jersey, New York, Rhode Island, South Carolina, Tennessee, Vermont, and Virginia. The broader pattern is one of low specificity and no enforceability. Without detailed requirements and penalties for non-compliance, transparency remains vulnerable to rollback and uneven execution.
Case Studies on Transparency Standards
Florida
Florida’s framework is anchored in the Transparency Florida Act (Fla. Stat. § 215.985), enacted in 2009 and subsequently amended.39 The Act mandates comprehensive online publication of core fiscal data, including payments, contracts, payroll, and budget information. It grants explicit statutory authority to create and maintain specialized portals under the responsible agencies. Crucially, it also requires a single, unified point of access that links these databases so that the public can locate and navigate all relevant fiscal information from one canonical entry page. This combination of clear legal authority, functional specialization, and centralized discoverability lowers search costs, reduces fragmentation, and sets a best-practice model for research-grade transparency.
Florida’s statute goes further than most by enumerating required data elements for expenditure disclosure (including payee name, amount, transaction date, categorization, and supporting documentation), thereby reducing agency discretion and closing common loopholes. Its payroll provisions mandate publication of employee names, titles, and compensation across all state agencies, including the Florida College System. Florida also requires by law that all state contracts be published. This provides public access to core terms, total dollar values, procurement methods, and redacted full-text agreements through a centralized contract-tracking system.40 This statutory specificity (what to publish, for whom, and where) turns transparency from a principle into an operational obligation that supports auditability and analysis.
On the ground, the user experience delivers what the statute promises. Florida’s unified transparency landing page routes users to multiple specialized databases (e.g., contracts, payments, payroll, budget), some administered by different authorities but all publicly accessible and consistently maintained. The contract-tracking portal exemplifies the standard. In this portal, records extend back to the 1990s; search is robust (e.g., by vendor, date range, and contract value); each entry exposes at least nine data fields along with links to the redacted full agreement; and users can bulk-download the full result set from any query. Critically, entries include a stable contract identifier, enabling linkage to payment records and supporting lifecycle analysis from award to spend. This is precisely the kind of end-to-end traceability this report advocates.
Opening an individual contract surfaces the full record, including a line-item history of payments under the award, summaries of any audits conducted, downloadable copies of the contract and attachments, and clear statements of expected deliverables. In effect, Florida’s portal operates as a lifecycle tracker rather than a mere document shelf by allowing users to follow a contract from award through disbursements and oversight to closeout.
Florida’s payments portal exposes record-level detail, with 14 fields per transaction. Key fields include a contract number (when applicable), a transaction description, payment type, and three stable identifiers: Payment Number, Agency Document Number, and Statewide Document Number. These identifiers support deduplication, audit trails, and joins to related records (e.g., the contracts portal when a contract ID is present). Unusually, the portal also discloses the share of total vendor payments covered by the dataset, giving users a denominator for assessing completeness. These features make the checkbook not just viewable but analytically usable.
Florida’s transparency infrastructure reaches beyond mere compliance; it treats disclosure as an operating system, not just a website. Statute hard-wires specificity (what must be published, in which fields, and on what cadence), usability (a single statewide access point, robust search, bulk download, and plain-language documentation), and auditability (stable identifiers, cross-portal linkages, and embedded audit signals). The result is an integrated, research-ready environment that allows users to follow dollars from contract award through disbursements and oversight. The state sets a practical benchmark others can emulate.
Utah
Utah’s portal offers a polished, modern interface and intuitive navigation, which is a solid foundation for becoming a national leader in research-grade fiscal transparency. The next step is to deepen the underlying data layer so the site supports rigorous analysis as well as easy browsing. Enhancing public documentation, offering a free, open API, and introducing joinable identifiers and cross-links between appropriations, contracts, and payments would transform today’s presentational transparency into analytical transparency, and so unlock reproducible research, faster oversight, and richer civic use.
Both the vendor-payments and payroll portals already make it simple to look up individual records. By complementing that strength with true bulk export (not gated by vendor-specific queries), Utah can enable comprehensive analyses of spending patterns, cross-agency comparisons, and independent audit sampling. Expanding the payments schema beyond fiscal year, amount, paying entity, and vendor to include payment descriptions, contract references (award/PO numbers), and transaction identifiers (voucher/document IDs) would let users link payments to contracts, reconstruct ledgers, and replicate results at scale. With these incremental upgrades, Utah can pair its visual excellence with end-to-end, machine-readable fiscal data and set a model for accountability that other states can follow.
Policy Recommendations
To make transparency meaningful, states must move beyond simply having a portal to building an enforceable, research-grade transparency system. That means clear statutory mandates with timelines and remedies; full coverage of core fiscal domains (e.g., contracts, payments, payroll); standardized, machine-readable data with bulk downloads and open APIs; persistent identifiers that link appropriations → contracts → payments → outcomes; and plain-language documentation, versioning, and audit trails so results are reproducible. Usability is not optional. Portals should be searchable, accessible, and comprehensive across statewide entities (including quasi-public bodies). The recommendations that follow translate these requirements into concrete statutory clauses, minimum data schemas, and implementation checklists that close current gaps and align state practice with the highest standards of accountability and public use.
- Mandate a transparency portal in state statute. Portals sustained only by executive or administrative discretion are vulnerable to leadership turnover, shifting priorities, and budget cuts. Codification creates durable, cross-administration continuity and signals a long-term commitment to fiscal accountability. The statute should: require
- A single statewide point of access;
- Specify covered datasets and entities (e.g., contracts, payments, payroll; including quasi-public bodies);
- Set update frequency, retention, and uptime standards;
- Require open, machine-readable formats with bulk downloads/APIs and plain-language documentation;
- Assign custodial authority and baseline funding; and
- Include enforcement (e.g., deadlines, remedies, and audit oversight) so transparency is guaranteed by law, not by goodwill.
- Enumerate required data elements in statute (by dataset). Ambiguity about what must be disclosed is the leading cause of thin or inconsistent portals. The statute should therefore fix a minimum, uniform field list with definitions for each dataset, so agencies publish analytically useful, comparable records statewide.
- Payments (checkbook): record date; fiscal year/period; paying agency; fund; program/appropriation code (or strategy); vendor legal name; persistent vendor ID (masked if necessary but joinable); amount; purpose/description; object/ category code; voucher/transaction ID; PO/contract/award number (if applicable); payment method; grant/CFDA (if applicable).
- Contracts: solicitation ID; procurement method; award date; start/end dates; award/ceiling amount; spend-to-date; agency; program/appropriation code; vendor legal name; persistent vendor ID; scope/description (greater than 25 characters); amendment history (date/amount); URL to redacted full-text contract and amendments; performance/deliverables field (summary).
- Payroll: employee name (with narrowly tailored exemptions); position title; agency; FTE status; base pay; overtime; other compensation (itemized); total compensation; pay period/fiscal year; hire/separation dates (if applicable); pseudonymous employee ID for longitudinal analysis.
The statute should also:
- Require data dictionaries that define every field and code list;
- Mandate open, machine-readable publication with bulk downloads and API endpoints;
- Specify update frequency and retention;
- Require persistent join keys (such as appropriation/strategy codes, contract numbers, vendor IDs, voucher IDs) so records link across datasets; and
- Include privacy safeguards (e.g., redaction rules for protected roles and PII) without eliminating core fields.
To accommodate improvement, authorize the controller or treasurer to expand field lists by rulemaking, but forbid shrinking the baseline without statutory change.
- Require joinable identifiers linking payments to contracts to appropriations. Transparency is only auditable when every disbursement can be traced to a specific award. Statute should mandate a single, canonical contract/award ID issued at award and carried on every related obligation and payment. Where purchase orders/releases are used, the statute should require PO/Release IDs as secondary keys. Each payment record must also include a voucher/transaction ID and the code for the appropriation/ program funding it. For non-contract payments (e.g., intergovernmental transfers, court settlements), require a non-contract reason code so exceptions are explicit—not invisible.
Statutory elements to include:
- Identifier governance: Controller/treasurer assigns the Contract/Award ID; uniqueness enforced statewide; legacy numbers mapped via a published crosswalk.
- Scope: Keys required on all contract-related obligations, invoices, and payments; prohibition on issuing payment without the award/PO key unless coded as an approved non-contract exception.
- Data publication: Expose keys in portals, bulk downloads, and APIs; publish reference tables (include contract header, vendor master with persistent vendor ID, chart-of-accounts).
- Backfill and retention: Apply to new awards immediately; backfill keys on historical records for more than five and more than 10 years (or to system limits).
- Quality control: Quarterly integrity checks (referential integrity, orphaned payments, duplicate keys) with public logs.
- Standards alignment (recommended): Permit the agency to satisfy the requirement by adopting a recognized schema (e.g., an Open Contracting–style award/contract ID) so joins are portable.
This merge-key regime turns portals from browse-only sites into traceable ledgers where the public can test whether payments align with contract terms and legislative intent.
- Mandate publication of full contract texts (with narrow, reviewable exceptions). Listing vendors and dollar amounts is insufficient. Accountability requires seeing the actual terms: deliverables, milestones, pricing schedules, remedies, change orders, and performance clauses. Statute should therefore require public release of the full, redacted contract record for every award.
Statutory elements to include:
- Scope and completeness: Publish the executed agreement and all attachments (e.g., SOW/SLAs, pricing exhibits, specifications, data-security addenda, insurance, bonding), all amendments/change orders, renewals, terminations, cure notices, and closeout documents.
- Timelines: Post within 10 business days of execution/amendment and keep online for more than 10 years after closeout (or longest retention under records law).
- Formats and accessibility: Provide text-searchable, OCR’d PDFs (PDF/A) and, where feasible, HTML/text; include page-level bookmarks and preserve digital signatures. Ensure bulk download/API access and ADA/WCAG compliance.
- Redaction and exceptions: Permit redaction only for statutorily protected content (e.g., PII, bona fide trade secrets, sensitive security details). Require a redaction log per document stating the legal basis and page ranges; publish a public summary when content is withheld (e.g., security procurement). Time-limit vendor confidentiality claims (e.g., five years absent renewed showing). Provide an appeal process to the state auditor/attorney general. Publication is not a waiver of privilege.
- Linkage and metadata: Each contract record must expose a canonical Contract/Award ID, agency, program, or appropriation code, procurement method, award date, start and end dates, award/ceiling amount, spend-to-date, vendor legal name and persistent vendor ID, commodity/service codes, and a machine-readable attachments index (with filenames, dates, versions).
- Versioning and auditability: Maintain immutable version history, checksums, and time-stamped change logs for each posted file; never replace without preserving prior versions.
- Backfill: Apply prospectively and require retroactive posting for more than five–10 years (to system limits), prioritizing active and high-value contracts.
- Coverage: Include statewide agencies, higher-ed systems, authorities, and quasi-public entities; require sub-recipient agreements for grant pass-throughs where feasible.
Publishing full, linkable contract texts transforms portals from browse-only directories into auditable ledgers. The public can test value-for-money, detect red flags (such as non-competitive awards or serial amendments), and evaluate performance against deliverables. This brings contract oversight in line with modern expectations of fiscal accountability.
- Mandate publication of methodological notes and dataset documentation (human- and machine-readable). Portals often expose large fiscal datasets without the context needed to interpret them. Statutes should require clear, durable documentation so the public, journalists, auditors, and researchers can understand, validate, and reproduce results.
Statutory elements to include:
- Documentation at launch and with every update: Methodology notes and a data dictionary must be published concurrently with each dataset release and whenever the dataset is updated. Prior versions remain accessible.
- Data dictionary (per dataset): For every field: name, plain-language definition, data type/format, units, allowed values/code lists, nullability, derivation/business rules, and examples. Publish as both HTML/PDF and machine-readable (JSON/YAML/CSV).
- Provenance and ETL: Source systems; extraction/transform/load steps; inclusion/exclusion rules; aggregation levels; de-duplication logic; redaction rules; and links to any governing policies.
- Update cadence and latency: Note the scheduled update frequency (e.g., nightly/weekly/monthly), the timestamp of the last successful load, the typical lag from transaction to publication, and the planned maintenance windows.
- Coverage statement: What is included/excluded (including entities, funds, thresholds); proportion of total activity covered (e.g., the percentage of statewide vendor payments included); periods of missing data; and masking/suppression counts by category.
- Quality and validation: Published checks (e.g., schema validation, referential integrity, duplicate detection); summary quality metrics (percentage of completeness and error rate); and a changelog of resolved defects.
- Versioning and change log: Semantic version number for each dataset; dated notes for field additions/removals, definition changes, code-list updates; immutable archives of previous schemas and files with checksums.
- Join keys and crosswalks: Identification of persistent identifiers (including appropriation/strategy codes, contract/award IDs, PO/release numbers, vendor IDs, and voucher/transaction IDs) and publication of crosswalk tables where legacy IDs exist.
- API and bulk access guide (if provided): Endpoint list, parameters, pagination, rate limits, authentication (if any), and example queries; parallel documentation for bulk downloads (file layout, split logic, sizes).
- Citation and licensing: A required citation format, dataset DOI or stable identifier, and an open license (e.g., public-domain/CC0 or CC BY) with clear terms of reuse.
- Accessibility: Plain-language summaries; WCAG-conformant pages; printable PDFs; and, where feasible, bilingual/translation support.
- Support and accountability: Public contact channel and issue tracker; required response/cure periods; annual documentation review by the controller/auditor with a public attestation.
- Timelines and enforcement: Documentation must accompany initial publication and any schema/content change within five to 10 business days.
Noncompliance triggers a public notice, a cure period, and referral to the state auditor or attorney general. Repeated violations carry administrative penalties and are listed in an annual compliance report.
This requirement turns “open data” into usable, auditable data, and so reduces misinterpretation. It enables replication and gives end-users the context needed to trace dollars from appropriation to outcomes.
- Mandate machine-readability, bulk downloads, and open APIs (with versioning). Portals must be tools, not showcases. Statute should require formats and access modes that support analysis at scale—by anyone, without gatekeeping.
Statutory elements to include:
- Open, machine-readable formats: Publish all datasets in CSV and JSON (and Parquet for large tables); forbid disclosure-by-PDF/images as the only format. Use UTF-8, ISO-8601 dates/times, explicit currency/units, and one-record-per-row schemas.
- Bulk access: Provide full statewide files and historical archives (annual files plus rolling monthly snapshots). Allow downloads of entire datasets without arbitrary row caps (e.g., more than one million rows per file or complete extracts). Publish file manifests, check sums (SHA-256), and stable URLs.
- Open API: Provide read-only endpoints with filtering (date/agency/vendor/appropriation/contract), sorting, pagination, and field selection; document via an OpenAPI spec with example queries. Rate-limit reasonably; no paywalls; no approval hurdles for read access.
- Incremental updates: Support “since=” or versioned change feeds (adds/updates/deletes) so users can sync without having to download everything again.
- Versioning and retention: Maintain immutable archives, schema change logs, and dataset semantic versions; keep prior files online for more than 10 years.
- Join keys: Expose persistent identifiers (including appropriation/strategy codes, contract/award IDs, PO/release numbers, vendor IDs, voucher/transaction IDs) in both bulk files and APIs.
- Accessibility and licensing: Plain-language documentation, WCAG-conformant pages, and an open license (CC0/CC-BY or public-domain).
- Service levels and enforcement: Specify update cadences (e.g., payments within seven days of posting), 99.5 percent monthly uptime, and penalties/cure periods for noncompliance; require annual public attestations by the controller/auditor.
These provisions convert “open data” into usable, auditable infrastructure to enable automated oversight, reproducible research, and civic-tech tools that connect appropriations → contracts → payments → outcomes.
- Establish an enforceable compliance regime with clear penalties and incentives. Well-crafted transparency laws fail without teeth. Statute should convert obligations into verifiable duties, monitor compliance in public, and trigger predictable remedies when agencies fall short. At the same time, they should offer narrow, time-limited waivers when truly necessary.
Statutory elements to include:
- Duty to publish and maintain: Agencies must publish required datasets, documentation, and APIs by fixed deadlines; meet update cadences; and maintain monthly uptime of more than 99.5 percent for portals.
- Certification and accountability: The agency head/CFO must attest annually (and upon major updates) to completeness, accuracy, and timeliness; attestations and known limitations are posted publicly.
- Public compliance dashboard: The controller/auditor maintains a real-time scorecard showing per-dataset SLA status (including last update, latency, completeness percentage, and schema validity), open defects, and cure dates.
- Cure and escalation: Noncompliance triggers a written notice and a cure per 15–30 business days. If uncured, the controller/auditor escalates and posts the deficiency on the public dashboard.
- Remedies: Graduated, predictable penalties, including:
- Budgetary withhold (e.g., up to X percent of the agency’s administrative appropriation) until cured;
- Procurement holds on discretionary awards over $Y
(core services exempt) pending cure; - Attorney General/Auditor referral for injunctive relief;
- Civil penalties for willful or repeated violations;
- Classification of a reportable audit finding in the next financial/compliance audit;
- Consideration of compliance in executive performance reviews.
- Quality enforcement: Datasets must pass schema and referential-integrity checks (e.g., no orphaned payments, valid join keys). Failed checks are flagged “out of compliance” on the dashboard with required remediation dates.
- “No key, no pay” control: Disallow payment processing for contract-related disbursements without the required Contract/Award ID and voucher/transaction ID, unless coded to an approved non-contract exception.
- Limited waivers and appeals: Temporary waivers allowed only for documented system cutovers, cybersecurity events, or legal conflicts. Waivers must specify scope, duration, and mitigation, and are publicly posted. Agencies may appeal penalties to the auditor or attorney general.
- Private right of action (injunctive only): Grant residents and recognized watchdogs standing to seek injunctive relief and fees for clear statutory violations (no damages), ensuring a backstop when administrators fail to act.
- Whistleblower protection: Protect employees who, in good faith, report manipulation, suppression, or mislabeling of portal data.
- Incentives for compliance: Authorize small modernization grants and public recognition for agencies that exceed standards (e.g., publishing additional fields, backfilling history).
- Annual legislative report: The controller/auditor submits a yearly compliance
report to the legislature with recommendations to tighten standards where chronic gaps persist.
These mechanisms make transparency predictable and durable. Duties are clear, performance is visible, and noncompliance has consequences—turning portals from discretionary showcases into enforceable public-accountability systems.
Appendix
| Criteria | Description | Partial Credit | Points |
| Core Portal | |||
| Core transparency portal | The existence of a primary government transparency website, along with any associated or related websites that provide public access to transparency-related information | No partial credit | 1 |
| Checkbook portal | The existence of an online portal or database that discloses individual government expenditures, including payments made to specific recipients | No partial credit | 1 |
| Payroll portal | The existence of an online portal or database that discloses the salaries and compensation of government officials and employees | No partial credit | 1 |
| Contracts portal | The existence of an online portal or database that discloses comprehensive information on government contracts | No partial credit | 1 |
| Payments Portal | |||
| Filtered search | The ability to refine or narrow down search results using filters such as date, department, recipient, amount, or keyword | No partial credit | 2 |
| Downloadable in bulk | The ability to download payment data in bulk, with at least year-level granularity | Two points are awarded to states that provide bulk downloads covering a significant amount of data (example: 10,000 entries at once). | 4 |
| More than six fields of information | The dataset includes at least six distinct data fields (e.g., date, vendor, amount, department, purpose, category) | No partial credit | 4 |
| Recent payment (within one month) | The dataset includes at least one payment made within the past 30 days from the date of evaluation | No partial credit | 1 |
| More than five years of history | The dataset includes at least one payment made five years from the date of evaluation | No partial credit | 2 |
| More than 10 years of history | The dataset includes at least one payment made 10 years from the date of evaluation | No partial credit | 2 |
| Payroll Portal | |||
| Aggregate portal | The portal includes, at a minimum, some aggregate information about the salaries and compensation of government officials and employees | No partial credit | 1 |
| Name | The portal provides the names of government officials and employees, including cases where only the last name and initials are available | No partial credit | 0.5 |
| Position | The portal provides the job title/position of government officials and employees | No partial credit | 0.5 |
| Simple search | The portal provides a basic, unfiltered search function that allows users to search across all available data at once | No partial credit | 1 |
| Advanced search | The ability to refine or narrow down search results using filters such as name, department, position, etc. | No partial credit | 1 |
| Downloadable in bulk | The ability to download employee salary and compensation data in bulk | No partial credit | 1 |
| Contracts | |||
| Award amount | The dataset includes information on the award amount for each contract | No partial credit | 1 |
| Money spent amount | The dataset includes information on the amount of money spent so far for each contract | No partial credit | 1 |
| Filtered search | The ability to refine or narrow down search results using filters such as vendor, date, etc. | No partial credit | 2 |
| Description of contract | The dataset includes a description of each contract with a minimum of 25 characters | No partial credit | 2 |
| Publishment of contract PDFs | The dataset contains linkage to the actual contracts published | One point is awarded to states that provide downloadable contract data for some, but not all, contracts on a regular basis. | 2 |
| Downloadable in bulk | The ability to download contracts information in bulk, with at least yearly-level granularity | Two points are awarded to states that provide bulk downloads covering a significant amount of data (example: 10,000 entries at once). | 4 |
| Agency and vendor | The dataset includes, at a minimum, information about both the agency and the vendor involved in each contract | No partial credit | 2 |
| More than five years of history | The dataset includes at least one contract that began five years from the date of evaluation | No partial credit | 2 |
| More than 10 years of history | The dataset includes at least one contract that began 10 years from the date of evaluation | No partial credit | 2 |
| Publication of all contracts | The dataset includes all contracts without monetary thresholds (e.g., not limited to contracts over $10,000) and is not restricted to master agreements only | No partial credit | 3 |
| Integration and Budget | |||
| Merge key | The presence of a key or column, regardless of format, that links payments to contracts—or contracts to their corresponding payments | No partial credit | 2 |
| Appropriation | The dataset includes information on the budget appropriation or funding source associated with payments and contracts | No partial credit | 2 |
| Strategy | The dataset identifies the budget appropriation strategy or funding source linked to each payment or contract | No partial credit | 4 |
| Usability | |||
| Documentation | The portal provides documentation on how the dataset is assembled, along with a codebook explaining data fields and definitions | One point: the portal provides some information about the dataset’s assembly (e.g., what data is included). | 3 |
| Terms of Use | The portal publishes its Terms of Use in a clear and accessible manner | No partial credit | 2 |
| Open API | The portal provides access to an open Application Programming Interface (API) | No partial credit | 2 |
| Quality and Audit | |||
| Methodology notes | The portal provides notes on the dataset’s methodology, including details on data flow, processing steps, and any exclusions or limitations | No partial credit | 2 |
| Audit hash | The portal provides information on past audits done on the contracts and payments | No partial credit | 2 |
| Legal Framework | |||
| Any transparency clause | The state statute contains any transparency clauses, even without directly mandating a portal | No partial credit | 1 |
| Requirement of portal in statute | The state statute explicitly mandates the existence of a transparency portal | No partial credit | 1 |
| Partial list of required data items | The state statute explicitly lists the data items required for at least one database | No partial credit | 4 |
| Exhaustive list of data items | The state statute provides an overview or inventory that mentions more than four distinct types of data (e.g., payments, contracts, payroll, budget, revenue, assets) | No partial credit | 8 |
| Open formats | The state statute requires that the data be published in open formats with free and unrestricted public access | No partial credit | 3 |
| Machine readability | The state statute requires that the data be published in a machine-readable format | No partial credit | 3 |
| Documentation | The state statute explicitly mandates the publishing of documentation for the datasets | No partial credit | 1 |
| Enforcement | The state statute includes certain penalties, consequences, and/or other methods of enforcement for not following the transparency rules | No partial credit | 4 |

Stay Informed
Sign up to receive updates about our fight for policies at the state level that restore liberty through transparency and accountability in American governance.