
The Case for Incarceration

America’s cities are suffering under failed progressive policies. Random acts of violent crime, persistent disorder, and the continued destruction of the poorest communities and shared downtowns are the result of decades of bad choices by policymakers. It is time to return to a proven method of reducing crime and disorder: increasing rates of incarceration.
There are four essential findings that policymakers and the public must know:
- Most crime is committed by a small percentage of people.
- A small percentage of criminals account for almost all crime.
- There is no such thing as a “non-violent” or “low-level” offender. A property offender is statistically more likely to commit a new violent offense than a violent offender.
- Incarceration works by preventing criminals from continuing to victimize their communities, and is a proven strategy in reducing overall crime rates.
Policies must be enacted that adopt automatic persistent-offender enhancements and hold prosecutors and judges accountable for failing to uphold the law.
TABLE OF CONTENTS
· Introduction
· High-Rate Offenders
· The (Traditional) Criminal Justice System Works
· Progressive Prosecution and Crime
· Shifting Public Sentiment
· Conclusion
Introduction
John MacDonald, Ph.D., Professor of Criminology and Sociology at University of Pennsylvania, wrote a treatise in Vital City on the role criminology research should play in developing public safety policy, lamenting the lack of applied research findings to most reformers’ ideologically-driven approaches. Dr. MacDonald highlighted what he called “seven indisputable facts about crime and offenders” derived from decades of criminology research.
These seven indisputable facts are the following:
- Crime is highly concentrated by place. As little as 3% of addresses and 5% of street blocks account for more than 50% of crimes reported by citizens to the police.[1]
- Crime is also concentrated by times of day, days of the week, and months. Summers, nights, and weekends are peak times for violence.[2]
- Crime is highly concentrated among active offenders. Most of the criminal offending in the population is generated by a small fraction of chronic offenders, such that the incapacitation of one high-volume offender abates an estimated 9.4 felony offenses.[3]
- Just as crimes are highly concentrated among places and people, so are the social costs of crime.[4]
- Among criminal offenders, the rate of offending peaks in early adulthood, consistent with the “age-crime curve.”[5]
- Offenders do not specialize in specific offense patterns. Rather, active offenders tend to engage in what could be called a “cafeteria style” of offending. While some offenders show repeat behaviors, even the most optimistic approaches to estimating offense specialization can only find some modest evidence of offending preferences.[6]
- Criminal offending occurs within social networks, and the most active offenders tend to be clustered within dense criminal networks.[7]
Dr. MacDonald writes that “evidence-based crime policy should be guided by programs that confront these basic facts.”[8]
This review is focused on the utility of incapacitating high-rate offenders. The reality of a small set of offenders committing the clear majority of crimes requires a carceral response to keep communities safe.
High-Rate Offenders
It should be no surprise that five of MacDonald’s “seven indisputable facts” are related to the concentration of crime. Criminology research has long recognized that a select few offenders account for almost all crime commission.
This split, between the offending population and the nonoffending population, is crucial for actors in the criminal justice system responsible for public safety to recognize and accept.
The first Philadelphia Birth Cohort report, a series of studies following several cohorts of thousands of Philadelphia-born males across decades, found that only six percent of the cohort committed 52 percent of all juvenile criminal activity.[9] Follow-up studies of later cohorts found that criminal continuity was very common, meaning delinquent juveniles went on to become adult criminals, while nondelinquent juveniles remained noncriminal throughout their lifetimes.[10] Elliot (1994), using the National Youth Survey (NYS), found that minor transgressions were followed-on by serious violent crime.[11]
Prevalence and Frequency
A 2017 meta-analysis found prevalence of offenders (the proportion of people who engage in crime) and frequency of offending (the number of times an individual offends) are both highly concentrated among a select few.[12]
[“Fig. 2: Overall prevalence and frequency of offending” below][13]
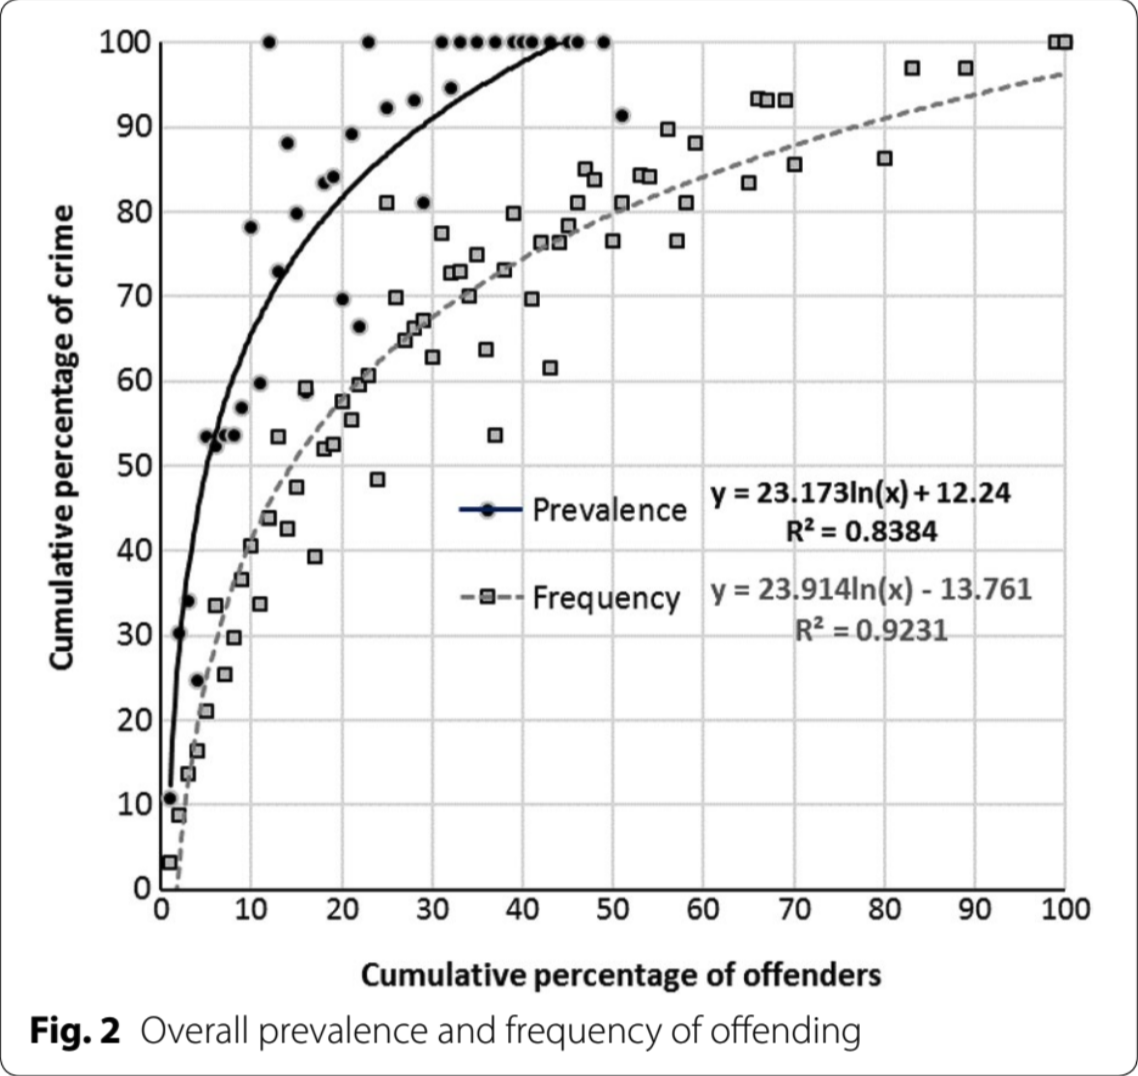
Specifically, the meta-analysis found that 10 percent of the general population accounts for 65 percent of crime, and 20 percent account for over 80 percent of all crime.
Practically, this supports a priority of clearly (or as clearly as practicable) delineating the criminal population from the non-criminal population.
A study following D.C. cohorts of arrestees found that individual frequencies of crime commission were independent of the number of prior convictions, and that active offenders committed an average of nine to 17 Index offenses per year.[14] Surveys of prisoners found self-reported frequencies of an average of 115 drug deals, 14 burglaries, and up to 22 robberies per person per year.[15]
When measuring frequency, 20 percent of all offenders commit nearly 60 percent of all crime.[16]
The prisoner survey found the highest-rate offenders self-reported committing more than 10 crimes per week, with peak offenders reporting an average of 70 robberies, 144 burglaries, and 229 thefts per year.[17]
Still, this means that among the general population, the proportion of people who commit crimes is more concentrated than the concentration of high-rate offenders among all offenders. This means the distinction among the criminal offender population is much less important than the distinction between the subset of offenders and the general population.
This is especially true given that, generally, offenders tend to simply commit crime, lacking focus or specialization. Elliot (1994) found that serious offenders “exhibited versatile offending patterns.”[18] Farrington (2002) found that most males convicted for a violent offense were convicted of a nonviolent offense as well, and violent crimes “occurred almost at random” in a criminal career, discrediting a “non-violent offender” mythology.[19]
Bureau of Justice Statistics
BJS data corroborate these findings.
Rearrest rates:
- Prisoners who were released after serving time for a property crime conviction were nearly just as likely to be rearrested for a violent crime as those who were incarcerated for a violent crime (29.6% vs. 32.4%, respectively). [20]
- Property-crime convicts were just as likely to be rearrested for robbery (5.4% vs. 6.2%), and more likely to be rearrested for burglary (17.1% vs. 6.7%), and larceny/motor vehicle theft (35.3% vs. 15.8%) than violent-crime convicts. [21]
- Shockingly, property-crime convicts were rearrested for homicide at similar rates as violent-crime convicts (0.7% vs. 1.0%, respectively).[22]
Violent recidivism:
- Those who were incarcerated for a drug offense were more likely to commit homicide than those who had been incarcerated for homicide, rape/sexual assault, robbery, or assault.[23]
- Similarly, those who had been incarcerated for burglary were more likely to commit homicide, rape/sexual assault, and robbery than individuals who had been released following a conviction of one of these offenses.[24]
The idea of an offender being “low-level” or “non-violent” is just plainly false. These offenders will go on to commit violent crime at rates similar to or greater than other “more dangerous” offenders, and, given the prisoner surveys, likely already have committed several of these more serious offenses.
Similarly, the idea of an offender being down on his luck or a low-propensity, one-off offender is equally false:
- Over seven in 10 released prisoners were rearrested within five years, and, of those rearrested, the average number of rearrests within five years was 3.78.[25]
- Seventy-nine percent of prisoners released in 2012 had been admitted for a new court commitment, while only 18 percent had been admitted for a supervision violation.[26]
- Forty-six percent returned to prison within five years for a new sentence or a supervision violation.[27]
- Almost three-quarters (74.4 percent) of prisoners had five or more prior arrests, and nearly half (43.3 percent) had 10 or more prior arrests.[28]
- The median offender had four prior convictions, while the mean offender had 5.4, indicating that there is an upper bound of especially high-rate offenders with significant incarceration history.[29]
- Those with 10 or more prior arrests were rearrested within five years at a rate of 81 percent, while those with two or fewer arrests were rearrested at a rate of 47.6 percent.[30]
- Violent offenders were rearrested within five years at a rate of 65.2 percent; drug offenders were rearrested at a rate of 69.8 percent; and property offenders were rearrested at a rate of 78.3 percent.[31]
Group Concentration
The unfortunate reality is that the criminal population is distinct from the nonoffending population and is responsible for the vast majority of crime, and that an even smaller subpopulation of very high-rate offenders is responsible for nearly all crime, though all offenders present a propensity for indiscriminate crime commission.
This is in line with the findings touted even by progressive activist groups such as Giffords, the anti-gun lobbying coalition.
- In a 2019 report, Giffords highlighted the findings of the California Partnership for Safe Communities, which found only 0.1 percent of Oakland’s population committed the majority of homicides.[32]
- Further, the report dispels the belief that the majority of offenders are youths (the average suspect age was 28).
- Perhaps most importantly, the report highlighted that 84 percent of homicides were “group member-involved,” a benevolently polite euphemism for gang violence.
- Gang members are also 200 percent more likely to return to prison than non-gang members.[33]
- Like all crime, even gun-related crimes are highly concentrated among a very small number of active, high-rate offenders. Compare the Oakland statistic of 84 percent of homicides being gang-related to 2021 data from Texas showing licensed concealed weapons holders accounted for just 0.141 percent of all crime.[34]
There is a demonstrated need for incarceration. These offenders, only comprising a small percentage of the overall population, are responsible for the vast majority of crime, and in turn, the vast majority of pain and suffering inflicted on communities, with particular exposure to the poorest and least advantaged of the community. Incapacitation is a worthy end in itself. By incapacitating the high-rate criminal, he is rendered unable to commit additional crimes.
There is even support for incarceration being positive for the offender, their immediate family, and of course (through the reduction in crime commission), their community at large.
The (Traditional) Criminal Justice System Works
MacDonald’s review of extant criminology research boils down to the following: to reduce crime, police should focus resources in crime-concentrated places, arrest high-volume offenders, and prosecutors should incapacitate those offenders in prison. This is the singular proven model for keeping communities safe from predation and fear of harm and allowing economic prosperity to flourish. Any rejection of this tradition leaves already-vulnerable communities unprotected.
1990s Crime Decline
In the 1990s, the United States experienced a substantial reduction in crime, in all categories of crime and across all parts of the nation.[35] Homicide rates fell 43 percent from 1991 to 2001 to 35-year lows, with similar reductions in violent and property crime indexes.
Steven D. Levitt, Ph.D., determined in a now-ubiquitous paper the four reasons for this (unexpected) decline in crime that was unique to the United States.
Levitt’s data point to (1) increases in the number of police, (2) increases in the incarcerated population, (3) the decline of the crack epidemic, and (4) the legalization of abortion as the four highest-impact causes of the crime decline.
Of all of Levitt’s findings, the increase in the prison population is found to have the highest certainty level of its estimated impact.[36] Levitt finds the increase in the prison population accounting for about a third of the decline in homicides (33%) and all violent crime (36%), and a quarter of the decline in property crime (25%). This determination is generally supported by other researchers[37], including Franklin Zimring in The Great American Crime Decline, though Zimring estimates the high-end impact of incarceration to be slightly less than Levitt.[38] Both Levitt and Zimring note the marginal elasticity of crime declines as incarceration increases, which is consistent with findings on the concentration of crime among offenders.
The Overincarceration Myth
It is oft-repeated that the United States incarcerates too many people—yet the truth is that the U.S. has an underincarceration problem.
Compared to peer nations, the United States is much more violent. The nation’s capital city had a homicide rate that was 35 times higher than London.[39] The U.S.’ violent incarceration rate is fifty percent larger than that of the European Union.[40] Overall, the homicide rate in the United States is five times that of Europe’s rate.[41]–[42]
- St. Louis alone has a higher homicide rate than Haiti.[43]
- In 2018, just a few blocks in three American cities (Chicago, Baltimore, and Detroit) saw a number of homicides equivalent to 10 percent of the combined homicide rate of the United Kingdom and Germany despite housing just 0.33 percent of the combined population.[44]
- This is all not to leave out that mass numbers of crimes go unreported in the United States, as only 40 percent of violent victimizations and 33 percent of property victimizations were reported in 2020.[45]
With this in mind, it should come as no surprise that while Europe’s incarceration rate is 111 per 100,000, in the U.S., it is 374 per 100,000.[46]–[47] Still, per homicide, the incarceration rate in the United States is lower than almost all peer nations.
Incarceration and Future Crime
Not only does incapacitation reduce crime commission by removing high-rate offenders, studies disprove the socialization myth that incarceration generally will lead to increased criminality. Research finds a neutral or negative (reductive) effect on future crime commission as a result of imprisonment. BJS data even show that the longer the term of incarceration, the lesser likelihood of recidivism.
In fact, some studies and pure BJS data show that increasing time served reduces the likelihood of reincarceration.
A 2013 study of sentencing disparities in Cook County, Illinois found no measurable increase of future re-offending as a result of imprisonment.[48] Another 2013 study in Pennsylvania found the same, as did a 2017 study in Michigan.[49]–[50] In fact, the Michigan study found that imprisonment (as opposed to community supervision) reduced the likelihood of a new felony conviction within five years by nearly 15 percentage points for non-Whites and nearly nine percentage points for Whites, with medium- or high-severity felonies decreasing by 10.6 percentage points and 5.4 percentage points within five years, respectively.[51] These results were highly statistically significant, especially the “any new felony” finding, which had a p-value of < 0.001.
According to BJS data, for every type of offense, the percentage of released prisoners who were re-arrested within five years was less for those who served more than the median time served before first release, as compared to those who served less than the median time served.[52]
- Those who served more than the median time for homicide were rearrested 17.6 percentage points (37.16 percent) less[53]
- Those who served more than the median time for rape or sexual assault were rearrested 11.5 percentage points (22.37 percent) less[54]
- Those who served more than the median time for robbery were rearrested 9.2 percentage points (11.98 percent) less[55]
- Those who served more than the median time for assault were rearrested 12.2 percentage points (15.97 percent) less.[56]
- Overall, each additional 6 months served for a violent offense reduces the likelihood of rearrest within 5 years of release by 2.7 percent, or 2 percentage points.[57]
For property crimes, the effect of serving more than the median time served was not as strong, but still reduced the likelihood of rearrest.
- For burglary, serving more than the median time reduced rearrest by 3 percentage points (3.77 percent)[58]
- For larceny or motor vehicle theft, the reduction was 5 percentage points (6.26 percent)[59]
- For all drug crimes, serving a lengthier sentence reduced rearrest by 5.5 percentage points (7.91 percent).[60]
Incarceration and Familial Outcomes
Incarceration is also good for the offender’s immediate family, especially his children or younger siblings.
A 2021 study on the effects of incarceration on young family members highlighted the intuitive benefits of incapacitation: a reduction in instances of domestic abuse, the deterrent effect of witnessing incarceration of a close family member, and the removal of an adverse influence.[61]
The authors, using 30 years of Ohio court data, find parental incarceration:
- Decreases the likelihoodof a child being incarcerated before age 25 by 4.9 percent[62]
- Decreases the likelihood of being charged with a crime by 6.6 percent[63]
- Has no statistically significant impact on test scores or grade point averages[64]
- Make children, when grown, more likely to live in neighborhoods with significantly higher socioeconomic status than that of their childhood neighborhoods[65]
This is in line with findings of parental incarceration improving educational attainment and decreasing future criminality in children, including studies in Sweden, Norway, Finland, and Colombia.[66]
This should come as no surprise, as:
- Antisocial behavior in fathers, especially in resident-father families, is predictive of both short- and long-term antisocial behavior in children (itself predictive of criminal behavior).[67]
- Children who grow up in a single-parent household are at higher risk for antisocial behavior, but only if the father in a two-parent household does not engage in antisocial behavior himself.[68]
- When the father does engage in antisocial behavior, the child experiences worse behavioral outcomes in proportion to the amount of time the father spends in the home.[69]
- This is supported by historical research, including McCord (1991) finding that paternal interaction with the family has a direct influence on a child’s adult criminal behavior, and McCord’s later (1999) finding that criminal men were disproportionately likely to be aggressive in their families.[70]
Progressive Prosecution and Crime
Despite the wealth of literature demonstrating that crime is highly concentrated and that traditional sanctions work, the progressive view of prosecution is committed to decarceration and non-sentencing of criminal defendants. This leaves this high-volume subset of offenders free to continue committing crime.
The most prominent study (that is not flawed by misguided research methods or suspicions of biases from grantee motivations) was conducted by criminologist Thomas Hogan (2022). In his study, Hogan tested whether progressive prosecutorial policies had an effect on the number of homicides.[71]
Hogan’s Synthetic Philadelphia
Using Philadelphia (and District Attorney Larry Krasner) as a test case, Hogan’s synthetic control analysis determined the city experienced an increase of nearly 75 homicides per year as a result of Krasner’s progressive policies.
Under DA Krasner, the Philadelphia District Attorney Office saw:
- New prosecutions fall 51 percent[72]
- New sentencings fall 70 percent[73]
- Drug felony convictions fall 73 percent[74]
- Drug misdemeanor convictions fall 43 percent[75]
- Felon firearms convictions fall 54 percent[76]
In comparison to a non-treated synthetic Philadelphia, the real Philadelphia had an additional 74.79 homicides per year.[77] The difference-in-differences analysis had a statistically significant p value of 0.012. The rate of increase in homicides accelerated the longer the de-prosecution policies were in place, with the experiment finding these policies resulted in an additional > 100 homicides by 2019.[78]
Hogan also tested Chicago, which was found to have an increase of 169.60 homicides per year as a result of progressive prosecution policies (p = < 0.01), and Baltimore, which was found to have an additional 70.62 homicides per year under the same approach (p = 0.01219).[79]
Given what we know about prevalence of and frequency among offenders, this is not a surprise, though the lack of surprise makes it no less disturbing.
Preventable Baltimore Homicides
In a real-world study, the Maryland Public Policy Institute corroborated Hogan’s findings.
From 2015 to mid-2022, Baltimore suffered over 2,500 homicides, consistently making Baltimore one of, if not the, most dangerous cities in the United States.[80]
In a limited time period review (January 2019 – July 2020), of 110 homicide suspects[81]:
- 82 percent had serious criminal convictions prior to the homicide[82]
- 59 percent had previously committed a weapons crime or used a firearm in another offense[83]
- 44 percent had prior violent crime convictions[84]
Seventy-seven of the 110 homicide defendants had been convicted of serious offenses prior to the murder under Baltimore City State’s Attorney Marilyn Mosby.[85] Fully 79 percent (61 of 77) of homicide defendants convicted since 2015 should have been incarcerated at the time of the homicide incident. These defendants, convicted under CA Mosby, had faced incarceration terms that exceeded the time period from their disposition to the homicide incident.
If the alleged killers had been incarcerated for their eligible sentence,
they would not have been free to commit the alleged homicide.[86]
The fact that authorities had the opportunity to incapacitate these serious, often violent, offenders before they committed a homicide, yet did not in the name of justice, is a reflection of the short-sightedness of the progressive prosecutorial philosophy.
Shifting Public Sentiment
San Francisco
In San Francisco, progressive prosecutor Chesa Boudin was successfully recalled.[87] Voters felt his lenient policies resulted in “deteriorating street conditions, particularly around public drug use, retail theft, and car break-ins.”[88]
Under current District Attorney Brooke Jenkins, San Francisco’s criminal justice system is being used properly:
- 2024 had the highest felony filing rate percentage (68%) since at least 2011[89]
- The number of misdemeanor cases filed was also the highest in over a decade[90]
- Felony convictions are up over 17 percentage points, a 37 percent increase[91]
- Misdemeanor convictions have doubled from Boudin’s low[92]
- Successful weapons convictions have risen from 37 percent to 73 percent[93]
As a result:
- Larceny theft, assault, burglary, motor vehicle theft, robbery, and homicide are all trending downward[94]
Police have begun to bring more arrests to the district attorney offices, likely out of confidence that the arrests and charges would be handled appropriately.
As Jenkins, the liberal district attorney, stated, “Progressive does not mean do away with prosecution, do away with enforcing the law… It means being thoughtful about the way you do it.”[95]
Baltimore
Baltimore City State’s Attorney Ivan Bates says he’s been able to bring down violent crime by increasing the number of people his office puts behind bars.[96]
Bates beat out progressive prosecutor Marilyn Mosby in the 2022 Democratic primary.
He’s been able to convict more than 2,000 people for violent crimes. He says most are repeat offenders, and he’s gotten lengthier sentences, dropped fewer cases, and enhanced victim and witness support.[97]
All of the criminals his office has convicted in the last two years have been sentenced for at least five years’ imprisonment without the possibility of parole.[98]
As a result, the city has experienced two straight years of declines in homicides after suffering over 300 homicides annually for over a decade.[99]
Conclusion
- Most crime is committed by a small percentage of people.
- A small percentage of criminals account for almost all crime.
- There is no such thing as a “non-violent” or “low-level” offender. A property offender is statistically more likely to commit a new violent offense than a violent offender.
- Incarceration works by disallowing criminals to continue to victimize their communities and is a proven strategy in reducing overall crime rates.
- Longer sentences have the added bonus of reducing an offender’s likelihood of reoffending.
- Incarceration has a positive effect on the families of criminals.
- Progressive “soft-on-crime” policies are proven disasters and increase crime commission.
[1] Weisburd, David, et al., The Criminology of Place: Street Segments and Our Understanding of the Crime Problem. Oxford University Press, 2012.
[2] Lauritsen, Janet L., Ph.D., and Nicole White, Ph.D., “Seasonal Patterns in Criminal Victimization Trends.” Bureau of Justice Statistics, June 2014. https://bjs.ojp.gov/content/pub/pdf/spcvt.pdf.
[3] Piquero, Alex R., et al, “The Criminal Career Paradigm.” Crime and Justice: A Review of Research, vol. 30, p. 435. 2003. https://www.ojp.gov/pdffiles1/Digitization/202743-202750NCJRS.pdf.
[4] Chalfin, Aaron, “Economic Costs of Crime.” The Encyclopedia of Crime and Punishment, 2015.
[5] Farrington, D. P., “Age and Crime.” Crime and Justice, vol. 7, pp. 189-250. 1986. https://www.ojp.gov/ncjrs/virtual-library/abstracts/age-and-crime-crime-and-justice-v-7-p-189-250-1986-michael-tonry.
[6] Piquero.
[7] Papachristos, Andrew V., “The Coming of a Networked Criminology?” Measuring Crime and Criminality, 1st Ed. Routledge, 2011.
[8] MacDonald.
[9] Piquero, Alex R., et al, “The Criminal Career Paradigm.” Crime and Justice: A Review of Research, vol. 30, p. 368. 2003. https://www.ojp.gov/pdffiles1/Digitization/202743-202750NCJRS.pdf.
[10] Piquero, p. 369.
[11] Piquero, p. 371-372.
[12] Martinez, Natalie N., et al., “Ravenous wolves revisited: a systematic review of offending concentration.” Crime Science, vol. 6, no. 10. 2017. https://link.springer.com/article/10.1186/s40163-017-0072-2.
[13] Martinez.
[14] Piquero, p. 435.
[15] Piquero, p. 435.
[16] Martinez.
[17] Piquero, p. 435.
[18] Piquero, p. 371-372.
[19] Piquero, p. 370-371. See also, Kurtz, Devon, “The Myth of the Nonviolent Drug Offender.” City Journal. 20 October 2022. https://www.city-journal.org/article/the-myth-of-the-nonviolent-drug-offender.
[20] Durose, Matthew R. and Leonardo Antenangeli, Ph.D., “Recidivism of Prisoners Released in 34 States in 2012: A 5-Year Follow-Up Period (2012-2017),” p. 11. Bureau of Justice Statistics. July 2021. https://bjs.ojp.gov/sites/g/files/xyckuh236/files/media/document/rpr34s125yfup1217.pdf.
[21] Durose, p. 11.
[22] Durose, p. 11.
[23] Durose, p. 11.
[24] Durose, p. 11.
[25] Durose, p. 1.
[26] Durose, p. 4.
[27] Durose, p. 1.
[28] Durose, p. 3.
[29] Durose, p. 3.
[30] Durose, p. 7.
[31] Durose, p. 6.
[32] McLively, Mike and Brittany Nieto, “A Case Study in Hope: Lessons from Oakland’s Remarkable Reduction in Gun Violence.” Giffords Law Center to Prevent Gun Violence. April 2019. https://files.giffords.org/wp-content/uploads/2019/05/Giffords-Law-Center-A-Case-Study-in-Hope.pdf.
[33] Saunders, Jessica, et al., “Post-Release Recidivism among Gang and Non-Gang Prisoners in Arizona from 1985 through 2004.” ASU Center for Violence Prevention and Community Safety. December 2009. https://cvpcs.asu.edu/sites/default/files/content/projects/Saunders_Sweeten_Katz122309.pdf.
[34] Texas Department of Public Safety, “Conviction Rates for Handgun License Holders.” March 2022. https://www.dps.texas.gov/sites/default/files/documents/rsd/ltc/reports/convictionratesreport2021.pdf.
[35] Levitt, Steven D., “Understanding Why Crime Fell in the 1990s: Four Factors that Explain the Decline and Six that Do Not.” Journal of Economic Perspectives, vol. 18 no. 1, p 163. Winter 2004 https://pubs.aeaweb.org/doi/pdfplus/10.1257/089533004773563485.
[36] Levitt, p. 184.
[37] Levitt, p. 178.
[38] Zimring, Franklin E., The Great American Crime Decline, p. 55. Oxford University Press, 2007.
[39] Mac Donald, Heather, “Trump is Right to Send the National Guard to Washington.” City Journal. 14 August 2025. https://www.city-journal.org/article/trump-national-guard-washington-dc-crime.
[40] Kurtz, Devon, “Invest in More Cops.” City Journal. 21 April 2023. https://www.city-journal.org/article/invest-in-more-cops.
[41] Uniform Crime Reporting Program, “Reported Crimes in the Nation, 2024.” https://cde.ucr.cjis.gov/LATEST/webapp/#.
[42] Eurostat, “Crime Statistics.” https://ec.europa.eu/eurostat/statistics-explained/index.php?title=Crime_statistics.
[43] Altheimer, et al., “2024 Homicide Statistics for 24 U.S. Cities.” https://www.rit.edu/liberalarts/sites/rit.edu.liberalarts/files/docs/CPSI%20Working%20Papers/2025-02_CPSI%20Working%20Paper_US%20City%20Homicide%20Stats.pdf.
[44] Mangual, Rafael, Criminal Injustice, p. 45. Center Street. July 2022.
[45] Mangual, p. 52.
[46] Eurostat, “Prison statistics.” April 2025. https://ec.europa.eu/eurostat/statistics-explained/index.php?title=Prison_statistics.
[47] Bureau of Justice Statistics, “Prisons Report Series: Preliminary Data Release, 2023.” December 2024. https://bjs.ojp.gov/library/publications/prisons-report-series-preliminary-data-release-2023.
[48] Loeffler, Charles E., “Does Imprisonment Alter the Life Course? Evidence on Crime and Employment from a Natural Experiment.” Criminology, vol. 51, no. 1, pp. 137-166. February 2013. https://onlinelibrary.wiley.com/doi/full/10.1111/1745-9125.12000.
[49] Nagin, Daniel S. and G. Matthew Snodgrass, “The Effect of Incarceration on Re-Offending: Evidence from a Natural Experiment in Pennsylvania.” Journal of Quantitative Criminology, vol. 29, no. 4, pp. 601-642. December 2013. https://www.jstor.org/stable/43552154.
[50] Harding, David J., et al., “Short- and long-term effects of imprisonment on future felony convictions and prison admissions.” Proceedings of the Natural Academy of the Sciences, vol. 114, no. 42, pp. 11103-11108. October 2017. https://www.pnas.org/doi/epdf/10.1073/pnas.1701544114.
[51] Harding, p. 11106.
[52] Durose, p. 14.
[53] Durose, p. 15.
[54] Durose, p. 15.
[55] Durose, p. 15.
[56] Durose, p. 14.
[57] Durose, p. 15.
[58] Durose, p. 14.
[59] Durose, p. 14.
[60] Durose, p. 14.
[61] Norris, Samuel, Matthew Pecenco, and Jeffrey Weaver, “The Effects of Parental and Sibling Incarceration: Evidence from Ohio.” The American Economic Review, vol. 111, no. 9, p. 2927. 2021. https://www.jstor.org/stable/27086097.
[62] Norris, p. 2928.
[63] Norris, p. 2928.
[64] Norris, p. 2928.
[65] Norris, p. 2928.
[66] Norris, p. 2929.
[67] Coley, R.L., J. Carrano, and S. Lewin-Bizan, “Unpacking links between fathers’ antisocial behaviors and children’s behavioral problems: direct, indirect, and interactive effects.” Journal of Abnormal Child Psychology, vol. 39, no. 6. 2011. doi: 10.1007/s10802-011-9496-4.
[68] Coley, R.L., J. Carrano, and S. Lewin-Bizan, “Unpacking links between fathers’ antisocial behaviors and children’s behavioral problems: direct, indirect, and interactive effects.” Journal of Abnormal Child Psychology, vol. 39, no. 6. 2011. doi: 10.1007/s10802-011-9496-4.
[69] Jaffee, S.R., T.E. Moffitt, A. Caspi, and A. Taylor, “Life with (or without) father: the benefits of living with two biological parents depend on the father’s antisocial behavior.” Child Development, vol. 74, no. 1. 2003. doi: 10.1111/1467-8624.t01-1-00524.
[70] Piquero, p. 367-368.
[71] Hogan, Thomas P., “De-prosecution and death: A synthetic control analysis of the impact of de-prosecution on homicides.” Criminology & Public Policy, vol. 21 no. 3, pp. 489-534. 2022. https://www.deepdyve.com/lp/wiley/de-prosecution-and-death-a-synthetic-control-analysis-of-the-impact-of-wC1DHNov98.
[72] Hogan, p. 500.
[73] Hogan, p. 500.
[74] Hogan, p. 500.
[75] Hogan, p. 500.
[76] Hogan, p. 500.
[77] For clarity, the treatment was the progressive prosecution policies under DA Krasner.
[78] Hogan, p. 503.
[79] Hogan, p. 509.
[80] Kennedy, Sean, “Baltimore’s Preventable Murders: The Role of Prior Convictions and Sentencing in Future Homicides,” p. 1. Maryland Public Policy Institute. 11 July 2022. https://www.mdpolicy.org/library/doclib/2022/07/Maryland-Policy-Report-2022-01.pdf/.
[81] I will use the term “suspect” even if a subset of offenders has been convicted for readability reasons.
[82] Kennedy, p. 1-2.
[83] Kennedy, p. 1-2.
[84] Kennedy, p. 1-2.
[85] Kennedy, p. 2.
[86] Kennedy, p. 2.
[87] Echeverria, Danielle, “Here’s what prosecution data tells us about how S.F. officials are treating crime.” San Francisco Chronicle. 12 March 2025. https://www.sfchronicle.com/crime/article/sf-boudin-jenkins-prosecution-20190170.php/.
[88] Echeverria.
[89] San Francisco District Attorney, “Data Dashboards.” https://sfdistrictattorney.org/policy/data-dashboards/#incidents-arrests-prosecutions.
[90] San Francisco District Attorney, “Data Dashboards.” https://sfdistrictattorney.org/policy/data-dashboards/#incidents-arrests-prosecutions.
[91] San Francisco District Attorney.
[92] San Francisco District Attorney, “Data Dashboards.” https://sfdistrictattorney.org/policy/data-dashboards/#incidents-arrests-prosecutions.
[93] San Francisco District Attorney.
[94] DataSF, “Police Department Incident Reports: 2018 to Present.” https://data.sfgov.org/d/wg3w-h783/visualization.
[95] Echeverria.
[96] Wright, Ja Nai, “Ivan Bates report surge in convictions as Baltimore sees drop in violent crime and homicides.” WMAR2 Baltimore. 14 January 2025. https://www.wmar2news.com/local/ivan-bates-shares-how-his-office-has-increased-incarcerations-by-1-000-so-far-in-his-term/.
[97] Wright.
[98] Wright.
[99] Dixon, Sheila, “Sheila Dixon: State’s Attorney Ivan Bates is overqualified and underpaid.” The Baltimore Sun. 2 April 2025. https://www.baltimoresun.com/2025/04/02/sheila-dixon-states-attorney-ivan-bates-is-overqualified-and-underpaid-guest-commentary/.

Stay Informed
Sign up to receive updates about our fight for policies at the state level that restore liberty through transparency and accountability in American governance.