
Earnings-Weighted Funding: Higher Education Funding For Lasting Student Success


Introduction
Higher education is an important part of America’s social fabric. It creates opportunities for students to discover new passions, develop marketable skills, and become engaged citizens. In 2024, state and local governments disbursed more than $139 billion in higher education funding across the country.1 However, continually increasing tuition and lackluster performance on key outcomes have called the value of this funding into question. For example, the average annual earnings differential between high school graduates and bachelor’s degree holders fell from $32,900 in 2000 to $29,867 by 2015.2 Graduation rates are also strikingly low, with only 41 percent of students at four-year institutions graduating within four years and 60 percent graduating within six years.3 Meanwhile, student loan debt continues to pile up, reaching $1.8 trillion in 2024, from only $400 billion as recently as 2005.4
The picture is even worse for students from disadvantaged family backgrounds. A mere 11 percent of students from families in the lowest income quartile earn a Bachelor’s degree by the age of 24.5 Additionally, a 2016 study by the Upjohn Institute for Employment Research found that “the proportional increase in career earnings from obtaining a bachelor’s degree, relative to a high school diploma, is much smaller for individuals from lower income families compared to those from higher-income families.”6-7 The authors found that the earnings premium of a bachelor’s degree for students from low-income families is 71 percent, while the average premium for all students is 136 percent.8
Student outcomes also vary widely by institution. At the four-year institutions with the top 10 percent of graduation rates in the United States, more than four in five students complete their degree. By contrast, at schools in the bottom 10 percent, fewer than one in five students complete their degrees.9 Similarly, a typical student who attends a four-year institution in the top 10th percentile of the institutional earnings distribution has earnings of about $55,000 per year, while a typical student who attends a four-year institution at the bottom 10th percentile has annual earnings of about $30,000.10 There are even wide variances in the outcomes of students at two-year institutions with open admissions policies, meaning that, while admission selectivity may account for some outcome differences, it is not the sole determining factor of a student body’s success.11 Such striking differences amongst institutions suggest that many schools have the ability to institute policies and practices that would greatly improve the earnings outcomes of their students. They also suggest that students could improve their earnings outcomes by attending a post-secondary institution that has a better track record on student earnings.
We need a higher education system that provides students with a foundation for economic success, that responds to changes in the marketplace with innovative degrees, and that leverages the science of learning to help students to achieve their goals. Every institution has unique constraints, and thus the policies, practices, and strategies necessary to realizing such goals will differ for each institution. Therefore, top-down regulatory mandates by national accreditors or the Department of Education (such as minimum numbers of tenured faculty, minimum seat time, or lengthy approval processes for new programs) cannot ensure successful outcomes.12 Instead, we propose using public funding to align the incentives of postsecondary institutions with the long term financial success of their students. Specifically, we advocate for the use of a performance-based funding formula that allocates state public higher education funding based on the post-graduation earnings of an institution’s students. Earnings-Weighted Funding recognizes and rewards those schools who find innovative ways to help their students achieve lasting success.
Performance-Based Funding in Higher Education
In the United States, approximately 85% of public higher education appropriations occur at the state level.13 In 2024, the average state-level public higher education appropriation per Full Time Equivalent (FTE) student was $7,510.14-15 The lowest appropriation per FTE in 2019 was $4,629 in New Hampshire and the highest was $25,529 in Illinois.16
Current Programs and Results
In Fiscal Year 2020, 30 states distributed their funding to public postsecondary institutions using some variant of performance-based funding, a method in which states allocate funds according to institutional performance on specific student outcomes.17 While all performance-based funding mechanisms are distinguished from enrollment-based funding or discretionary funding by their focus on outcomes, the details of these mechanisms vary widely. In FY 2020, seven states used performance-based funding for two-year institutions only, 21 states used it for both two-year and four-year institutions, and two states used it for four-year institutions only. The outcomes measured to gauge performance also varied widely from state to state. For example, 28 states use some measure of graduation or degree completion, 19 states include choice of major, 22 use equity metrics, and 11 have some sort of measurement for degree efficiency. Finally, the proportion of total state funding allocated through performance-based funding varies from one percent in Illinois to 100 percent in Arkansas and North Dakota.
During its long history in the U.S., the results of performance-based funding efforts have been mixed. The first wave of performance-based funding in America occurred from roughly 1979–2000 and most of the models did not significantly alter student outcomes. A more robust second wave picked up around 2007, however, and has shown some positive results. For example, in Indiana (which fully implemented its current model in 200918), full-time Bachelor’s degree students showed significant positive results in degrees earned within four years.19 A study by Research for Action shows that the probability of graduating on-time for the average full-time university student in Indiana increased by 2.3 percentage points (576 additional students) for the 2011 cohort as a result of the model.20 In addition, degrees earned in high-impact fields (such as Science, Technology, Engineering, and Math, or STEM fields) significantly increased since the model’s implementation. The estimated impact on the 2011 cohort was 197 additional full-time students completing high-impact degrees within four years.21 Despite these successes, however, Indiana’s Pell-eligible bachelor’s degree students didn’t show any significant change in degrees earned within four years, six years, or in “highimpact” fields, even with the state’s prioritization of low-income student degree completion since 2009.22 Meanwhile, studies on models in Washington, Ohio, and Tennessee have shown that, in these states, performance-based funding actually brought declines in degree completion at some community colleges after implementation.23
Performance Based Funding and Job Market Outcomes
Such mixed results are due to the specific incentive structures created by particular state formulas. The biggest weakness of some performance-based funding structures is the ability for institutions to increase performance on key measures without actually improving the longterm success of students.
For example, formulas that give equal weight to all types of completion can incentivize institutions to push students toward lower-tier associates degrees and certificates rather than bachelor’s degrees. Where performance-based funding brought declines in degree completion (Washington, Tennessee, and Ohio), this was always accompanied by increases in short-term certificates.24–25 And when examining community college models across the nation that have a large proportion of performance-based funding tied to the base budget, mission-differentiation metrics, premiums for underrepresented groups, and longer periods of operation, a 2017 study again found increases in short-term certificates, no significant change in medium-term certificates, and decreases in associate’s degrees when all types of completion were weighted equally.26 Institutions often seek to increase more achievable metrics at the expense of other, less achievable ones.
In addition to this, states that only allocate a small percentage of funding to performance measures can only hope to have a small impact on outcomes. It may not be financially viable for an institution to invest in expensive high-touch student success programs if they expect only a small return. The National Center for Higher Education Management Systems suggests that at least 25 percent of total funding be allocated to performance-based funding in order to see significant results.27 Since relative funding stability is possible through performance based funding alone, however, we recommend that 100 percent of state public higher education funding be allocated through performance metrics, so as to achieve maximum impact on school practices and performance.28
Certain incentive structures can also encourage grade inflation and weakened academic standards. While degree completion is important, using it as a funding metric creates an incentive for postsecondary institutions to prioritize completion over job market preparation. In response to this problem, some states, such as Tennessee, have started including job placement standards in their models. In 1979, Tennessee was the first state to adopt performance-based funding in higher education.29 The state revisits the Quality Assurance Funding portion of its model every five years to improve results. Previous versions of the formula focused on intermediate and academic metrics such as retention and graduation rates. In the state’s 2010 update, however, Tennessee began including job placement as a metric for its two-year institutions. From FY11 to FY18 the job placement rates of Tennessee’s community college graduates continuously increased from 95 percent to 99 percent.30 Tennessee recognized the necessity of this addition because the successful improvement of academic metrics does not necessarily translate into better job market outcomes for students.
Successful performance-based funding will focus institutional attention on the ultimate goal of improved job market performance for students. Texas technical colleges (the six schools in the Texas State Technical College system) are the sole public institutions in the nation to date whose formula funding is based completely on the earnings outcomes of students. TSTC’s dual mission is workforce training and economic development, and in 2013 the Texas Legislature moved to align TSTC’s funding formula with these goals. The Texas Workforce Commission gathers data on student earnings for five years after graduation and any student with earnings above a minimum threshold contributes to the state funding received by their school. TSTC is paid a discounted percentage of the direct and indirect economic benefit that these wages provide to the Texas economy. The model has shown remarkable results for students: from 2010 to 2016, graduates of the TSTC system saw a 61 percent increase in first-year earnings.31
Unfortunately, the majority of America’s institutions of higher education currently have little to no incentive to ensure the job market success of their students. Only eight states include job market outcomes in their performance-based funding models, and only four of these include earnings as a funding measure.32 Even when states use some form of job performance measure, only in one case is this for all types of higher education institutions in the state. Except for Texas technical colleges, job market metrics are always accompanied by numerous intermediate academic metrics as well, hindering school-specific innovation and diverting priority away from career success. Furthermore, while 22 states have equity metrics based on enrollment or graduation rates, none currently have equity metrics base d on job market outcomes. Thus, even in states with job market outcomes in the performance-based funding structure, there remains no particular incentive to ensure job market outcomes for low-income students, who likely need institutional attention on career preparedness the most.
Many different factors can improve job market performance, including graduation, major choice, GPA, career planning and preparation, alumni support, etc. However, performance based funding is less effective if it focuses attention on these intermediate measures rather than long-term outcomes such as employment and earnings. In order for performance-based funding to improve outcomes for students in the job market, it must be a significant portion of total state higher education funding, and it must focus on increased earnings potential for students. In doing so, the model will simultaneously improve desired academic outcomes.
Modeling Earnings-Weighted Funding
Performance-based funding formulas are a great step towards aligning student and institutional incentives. However, the results are greatly dependent on the way that these incentives are structured. While 30 states tie public funding to student outcomes, only California, Florida, Kansas, and Texas included earnings as a metric in some part of their FY20 performance-based funding, and none of these prioritized earnings across the state.33 Without student earnings prioritized in the incentive structure, institutions will focus on increasing intermediate academic metrics, to the potential detriment of job market outcomes. Thus, we propose allocating state public funds based on Earnings-Weighted Funding, a performance-based formula that prioritizes long-term earnings metrics rather than academic outcomes.
Performance-based funding mechanisms will typically:
- Define a set of desirable outcomes.
- Create a weighted index score based on institutional performance for each outcome.
- Adjust the index score using equity or other quality assurance measures.
- Assign a proportion of total available funding to each institution based on the adjusted index score.
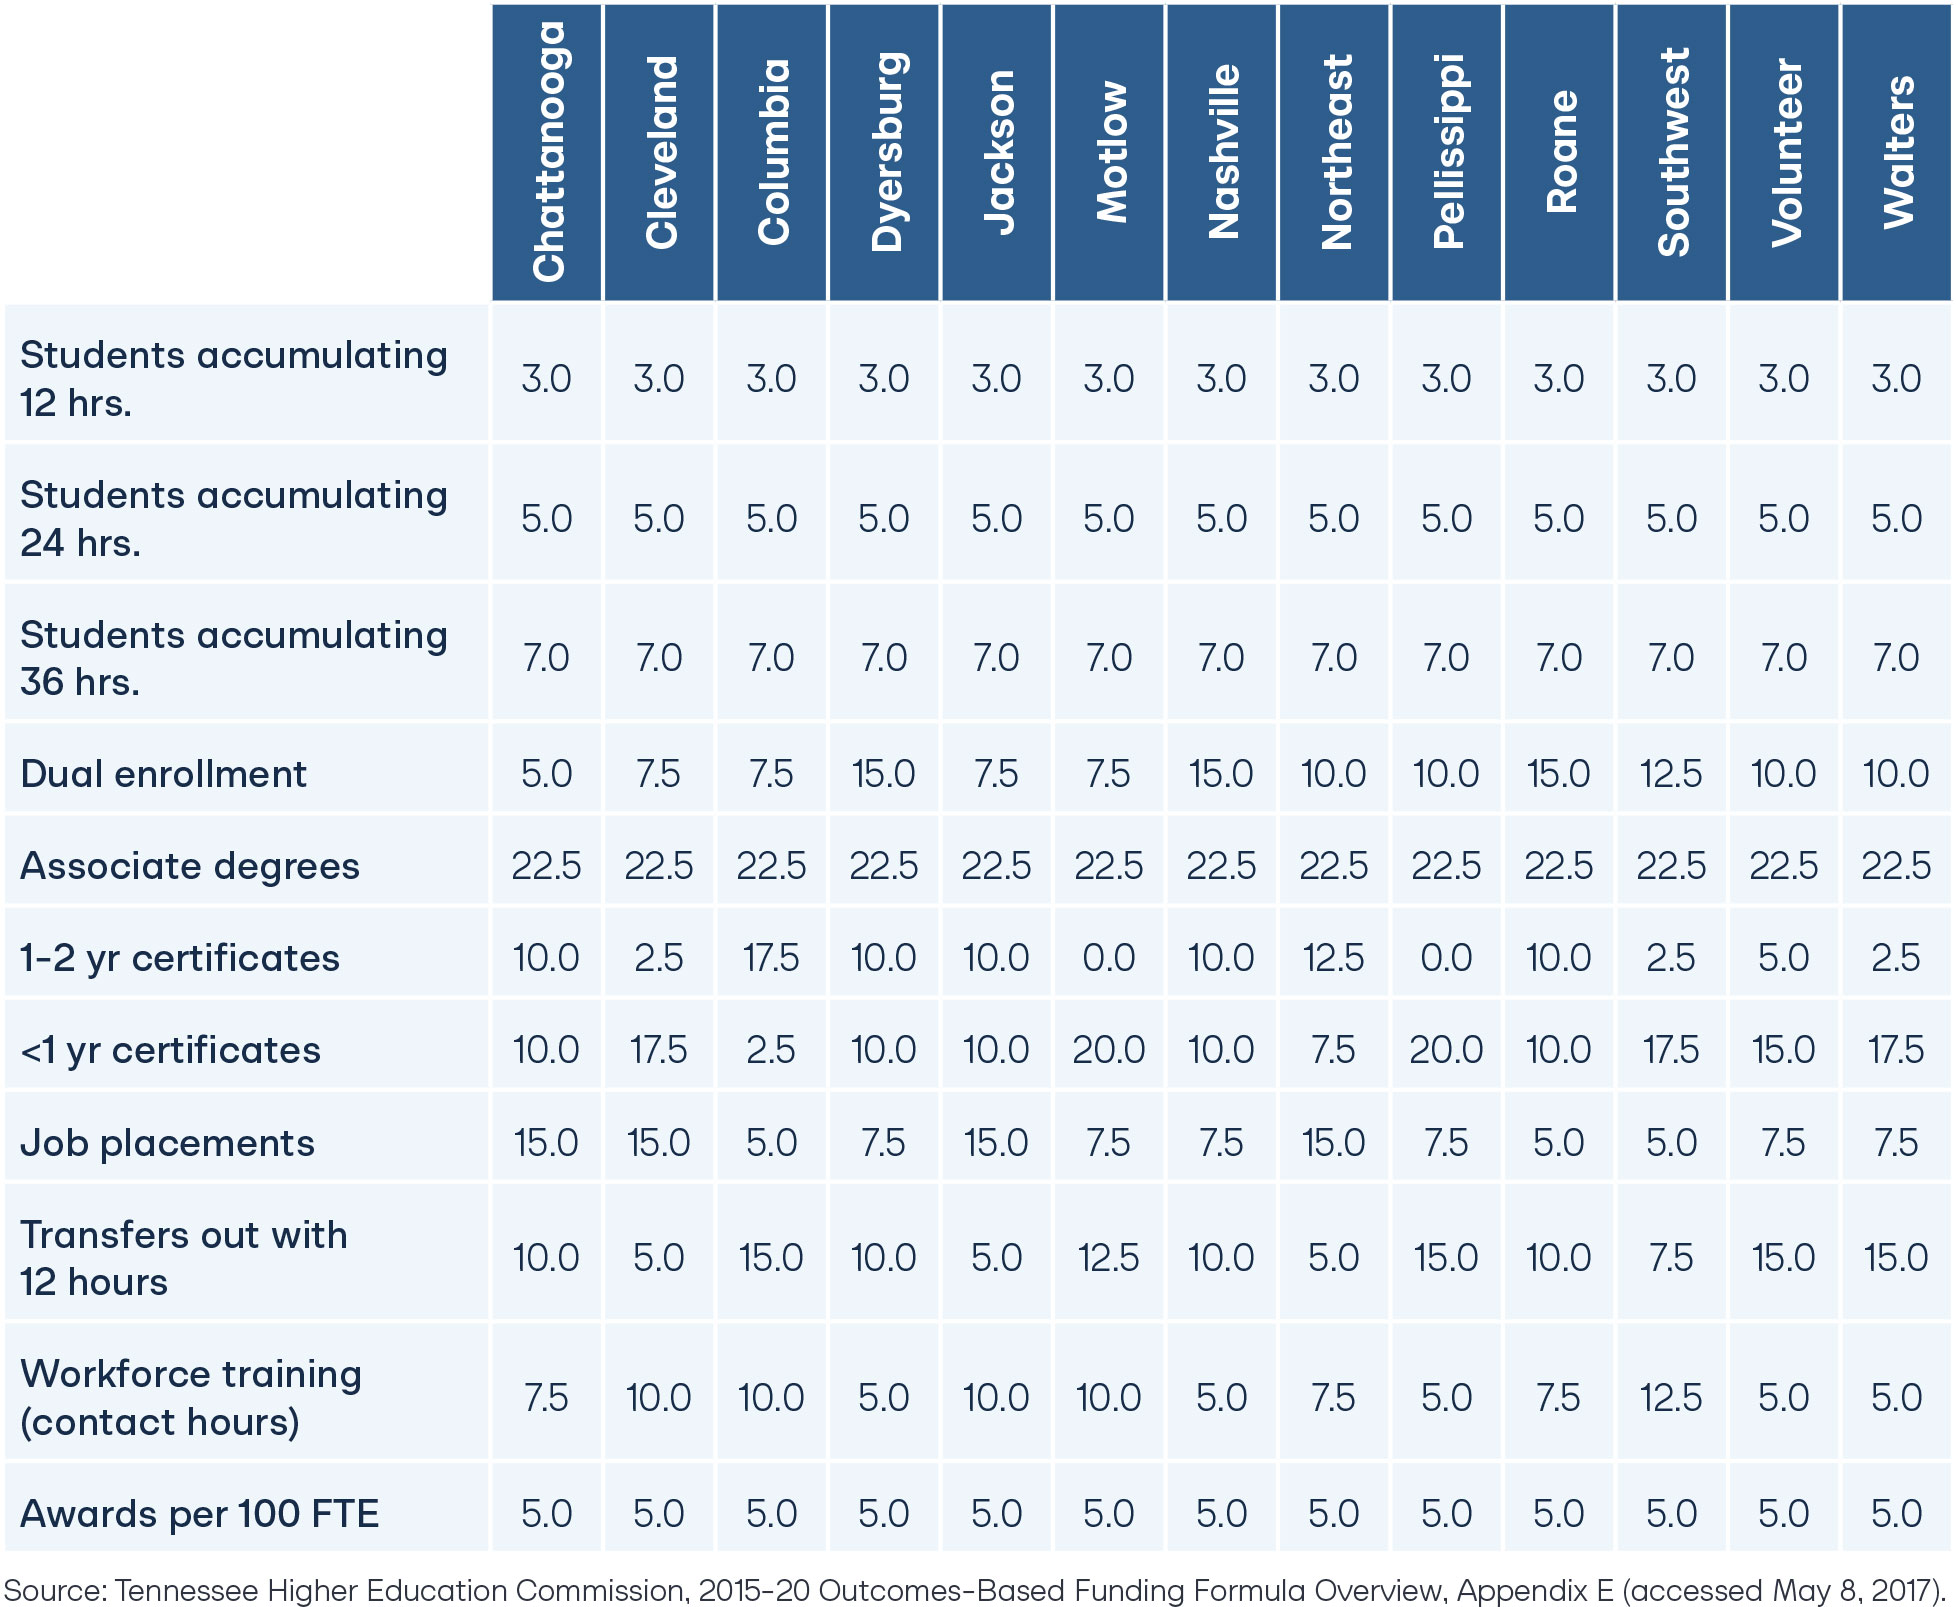
However, existing performance-based formulas are also often extremely complicated, in order to account for a wide array of valued outcomes, as well as differences in institutional missions. For example, as shown by the table below, Tennessee includes different metric weights for various institutions, as well as transfers and job placement performance metrics for its two-year institutions only, so as to better align outcomes with variances in institutional mission. The more complicated the formula, the more prescriptive it becomes, incentivizing institutions to meet intermediate goals rather than to innovate their own methods for improving the long-term success of students. By contrast, Earnings-Weighted Funding strongly prioritizes long-term earnings in order to allow institutions the freedom to use strategies that work for their specific student body. It has two distinguishing features:
- It strongly prioritizes student earnings.
- It uses equity measures to ensure gains for low-income students.
The Earnings/Threshold Ratio
We propose creating an earnings-weight by comparing the mean earnings of an institution’s students 10 years post-matriculation (10-Year Mean Earnings34) to the federal High School Threshold Earnings, thereby calculating a school’s Earnings/Threshold Ratio (ER).35-36 The 10Year Mean Earnings measure includes the earnings of all students who enrolled in the institution 10 years prior, are currently employed, and are no longer students. This includes students who complete their degree, those who do not, and those who transfer to different institutions.
The Earnings Ratio (ER) metric incentivizes institutions to support the most beneficial career path for their students, no matter what that path may be. Since degree completion is generally the most beneficial path to the economic success of a student, ER will incentivize institutions to increase degree completion for the majority of students.37 There are instances, however, when it would be more beneficial for the student to enter the workforce before earning her degree. Using ER as the measure of student career success also rewards institutions for recognizing and supporting career choices like this. With ER as the primary measured outcome in the funding model, institutions are incentivized to encourage enrollment in rigorous degrees, such as Computer Science, for the associated higher future earnings, even if this means more remedial courses or advising upfront.
Furthermore, institutions should be rewarded for serving enrolled students for the time that they attend the institution, even if a student never completes her degree or completes her degree at another institution. Community colleges, for example, will be able to increase the ER of their students by encouraging successful transfers to four-year institutions and by giving their students fundamental skill sets that will either help them in the job market or help them to further their education. In this way, community colleges are rewarded for their part in a student’s career success, even if the student does not receive a degree from that institution. Of course, if the institution does not serve a student well, then the ER measurement ensures that this is also reflected in the institution’s funding.
Short- and Long-Term Measures
EWF’s pared-down focus on job market outcomes provides freedom (and incentive) for postsecondary institutions to find the strategies that best improve student performance in the job market. These strategies may include remedial courses, coaching and advising, informed major choice, career preparation, and/or employer engagement, amongst others. However, with a focus on long-term earnings, the ultimate success of these strategies will only be revealed after a significant time lag. Ten-Year Mean Earnings is not available until 10-12 years after a student cohort matriculates. This lag in outcome measurement can make it difficult for institutions to assess strategies or recover from poor past performance. For this reason, funding formulas should include some short-term metrics.
It is important to note that including short-term metrics (such as credits completed, completion rates, or retention rates) can potentially be counter-productive to long-term goals. While these measures are currently correlated with long-term earnings, as seen in Washington, Tennessee, and Ohio, institutions are likely to institute policies that increase these measures while actually hurting the long-term earning potential of students.38 For example, retention rates—the percentage of first-time, first-year students who remain enrolled in year two are a common measure in performance-based funding. However, it is quite simple for an institution to increase retention rates by creating more permissive dismissal policies or encouraging grade inflation. Or, alternatively, institutions could increase the number of students completing 12 or 24 credits by shifting students toward less rigorous, lower paying majors early in their academic careers. Choosing retention rates or credit completion as targeted outcomes can, thus, create a tension between long-term earnings outcomes and short-term retention outcomes.
In order to ameliorate these concerns, we suggest including Six-Year Mean Earnings in the funding formula as well as 10-Year Mean Earnings. This data will be available much sooner than 10-Year Mean Earnings and should be strongly correlated with mid-career earnings. Including this shorter-term measure will allow institutions to see quicker results for their policy changes.39
Access Measures
Equally important to the earnings-weighted funding model are the access measures used to ensure that disadvantaged students experience gains in long-term earnings. Because students with disadvantaged backgrounds are often less prepared for postsecondary educational opportunities and tend to have lower earnings after graduation than students of other backgrounds, a focus on long-term earnings has the potential to discourage institutions from recruiting and admitting these students—students for whom education could play the largest transformative role. In order to ensure that EWF benefits these students, we advocate weighting the formula to:
- Reward institutions for enrolling students from low-income families.
- Directly reward institutions for improving the earnings outcomes of these students.
Without these additional access measures, institutions would be able to maximize their Earnings-Weighted Funding (EWF) score by reducing the number of disadvantaged students it enrolls, or by focusing its strategies on students from other backgrounds. Including these additional measures will incentivize institutions to place special attention on the success of their disadvantaged student populations.
Sample Formula
To see how the Earnings-Weighted Funding model works, consider the following formula.

1. Raw Metric Data
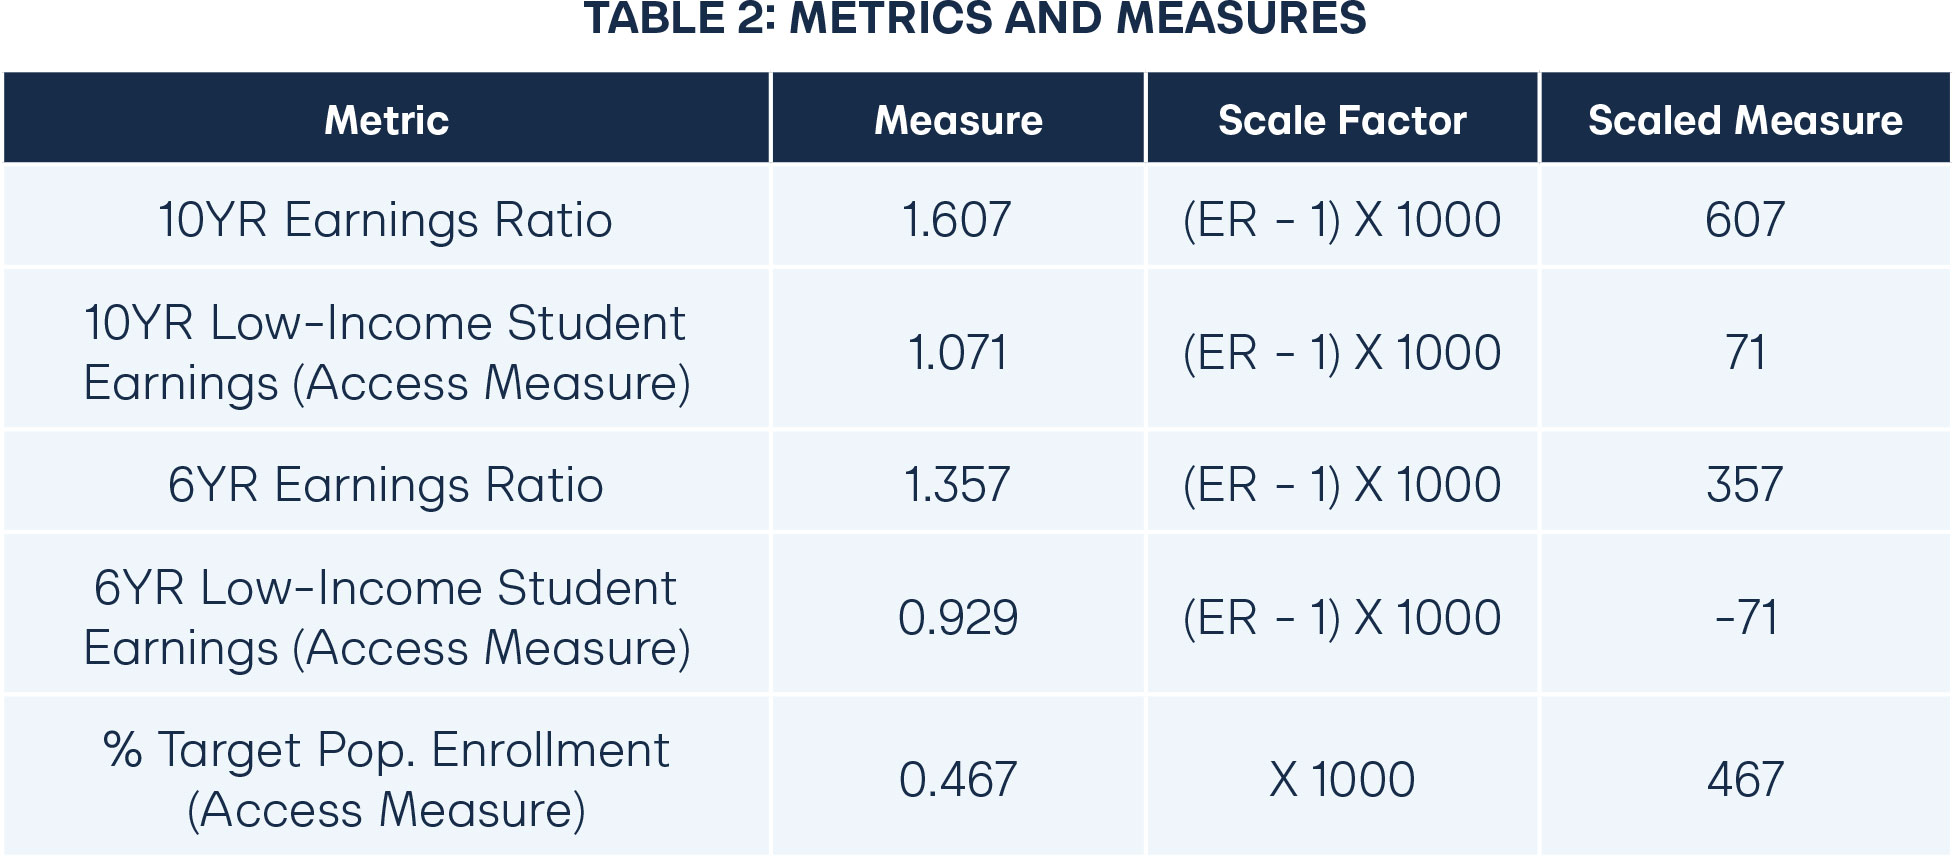
Table 2 shows the key performance metrics in the Earnings-Weighted Funding model:
- Base Measures
- Long-term Earnings Ratio (10-Year Mean Earnings/High School Threshold)
- Short-term Earnings Ratio (Six-Year Mean Earnings/High School Threshold)
- Access Measures
- 10-Year Earnings Ratio for Target Population
- Six-Year Earnings Ratio for Target Population
- Target Population Enrollment as a Percent of Total Enrollment
- In our model formula we will use low-income students approximated by students receiving Pell grants as our target population.
2. Scaled Metric Data
These measures are then scaled in order to create the Scaled Measure for each metric.40
For the sample institution depicted in Table 2, the 10-Year Mean Earnings for the entire student cohort is $45,000. The 10-Year Earnings Ratio is therefore:
$45,000/$28,000 = 1.607
The formula’s Scale Factor takes the 10-Year ER and subtracts 1 and multiplies by 1000, yielding 607 points in the example above:
1.607-1 = .607 X 1000 = 607
Subtracting by 1 creates a penalty for institutions with mean earnings below the High School Threshold.
In the above example, the Six-Year Mean Earnings for low-income students is $26,000, generating a Six-Year ER of 0.929:
$26,000/$28,000 = 0.929
Subtracting by 1 and multiplying by 1000 yields -71 points:
.929 – 1 = -0.071
-.071 * 1000 = -71
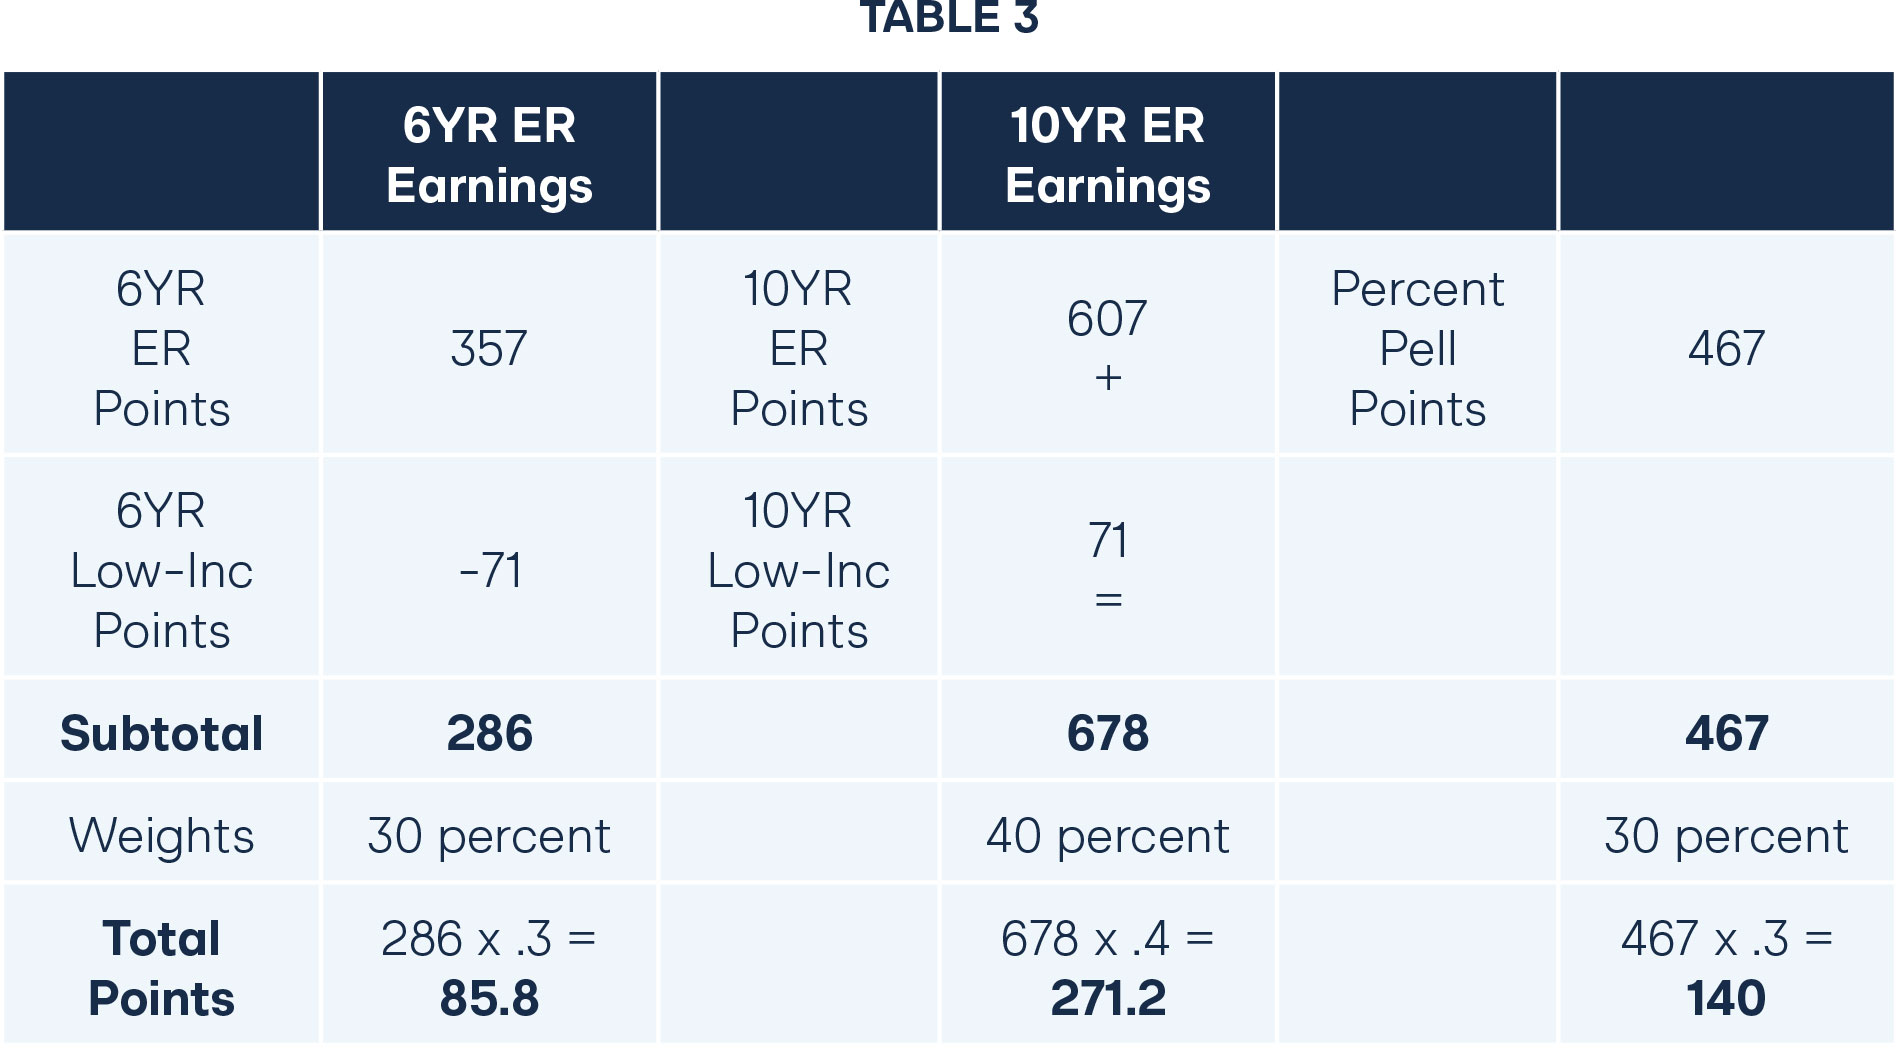
3. Metrics Combined and Weighted
To calculate the total points an institution earns, the scaled Base Measures and Access Measures are then combined and weighted according to program goals as shown in Table 3. In our example, the base 10-Year Earnings Ratio points are added to the Access 10-Year Earnings Ratio points and then multiplied by .4 to get 152 EWF points:
(610 + 71) X .4 = 271.2
4. EWF Score
After Scaled Base and Access Measures are combined and weighted for each metric, the EWF points are added together to get the total EWF Score.
10-Year Earnings Ratio 271.2 EWF Points
Six-Year Earnings Ratio 85.8 EWF Points
Percent Target Pop. Enrollment 140 EWF Points
EWF Score 497
5. Enrollment-Weighted Score
The institution’s total points are multiplied by institution’s enrollment to get Enrollment-Weighted Points. For an institution with enrollment of 10,000 students:
497 x 10,000 = 4,970,000 Enrollment-Weighted Points
6. Institution’s Allocation Share
Enrollment-Weighted Points as a percentage of Total System Points give each institution’s Allocation Share. Table 4 provides a sample system with 10 colleges. Each college has a unique EWF Score and enrollment. The allocation share for College A is determined as follows:
Enrollment-Weighted Points:
497 * 10,000 = 4,970,000
Allocation Share:
4,970,000 / 52,746,000 = 9.42%
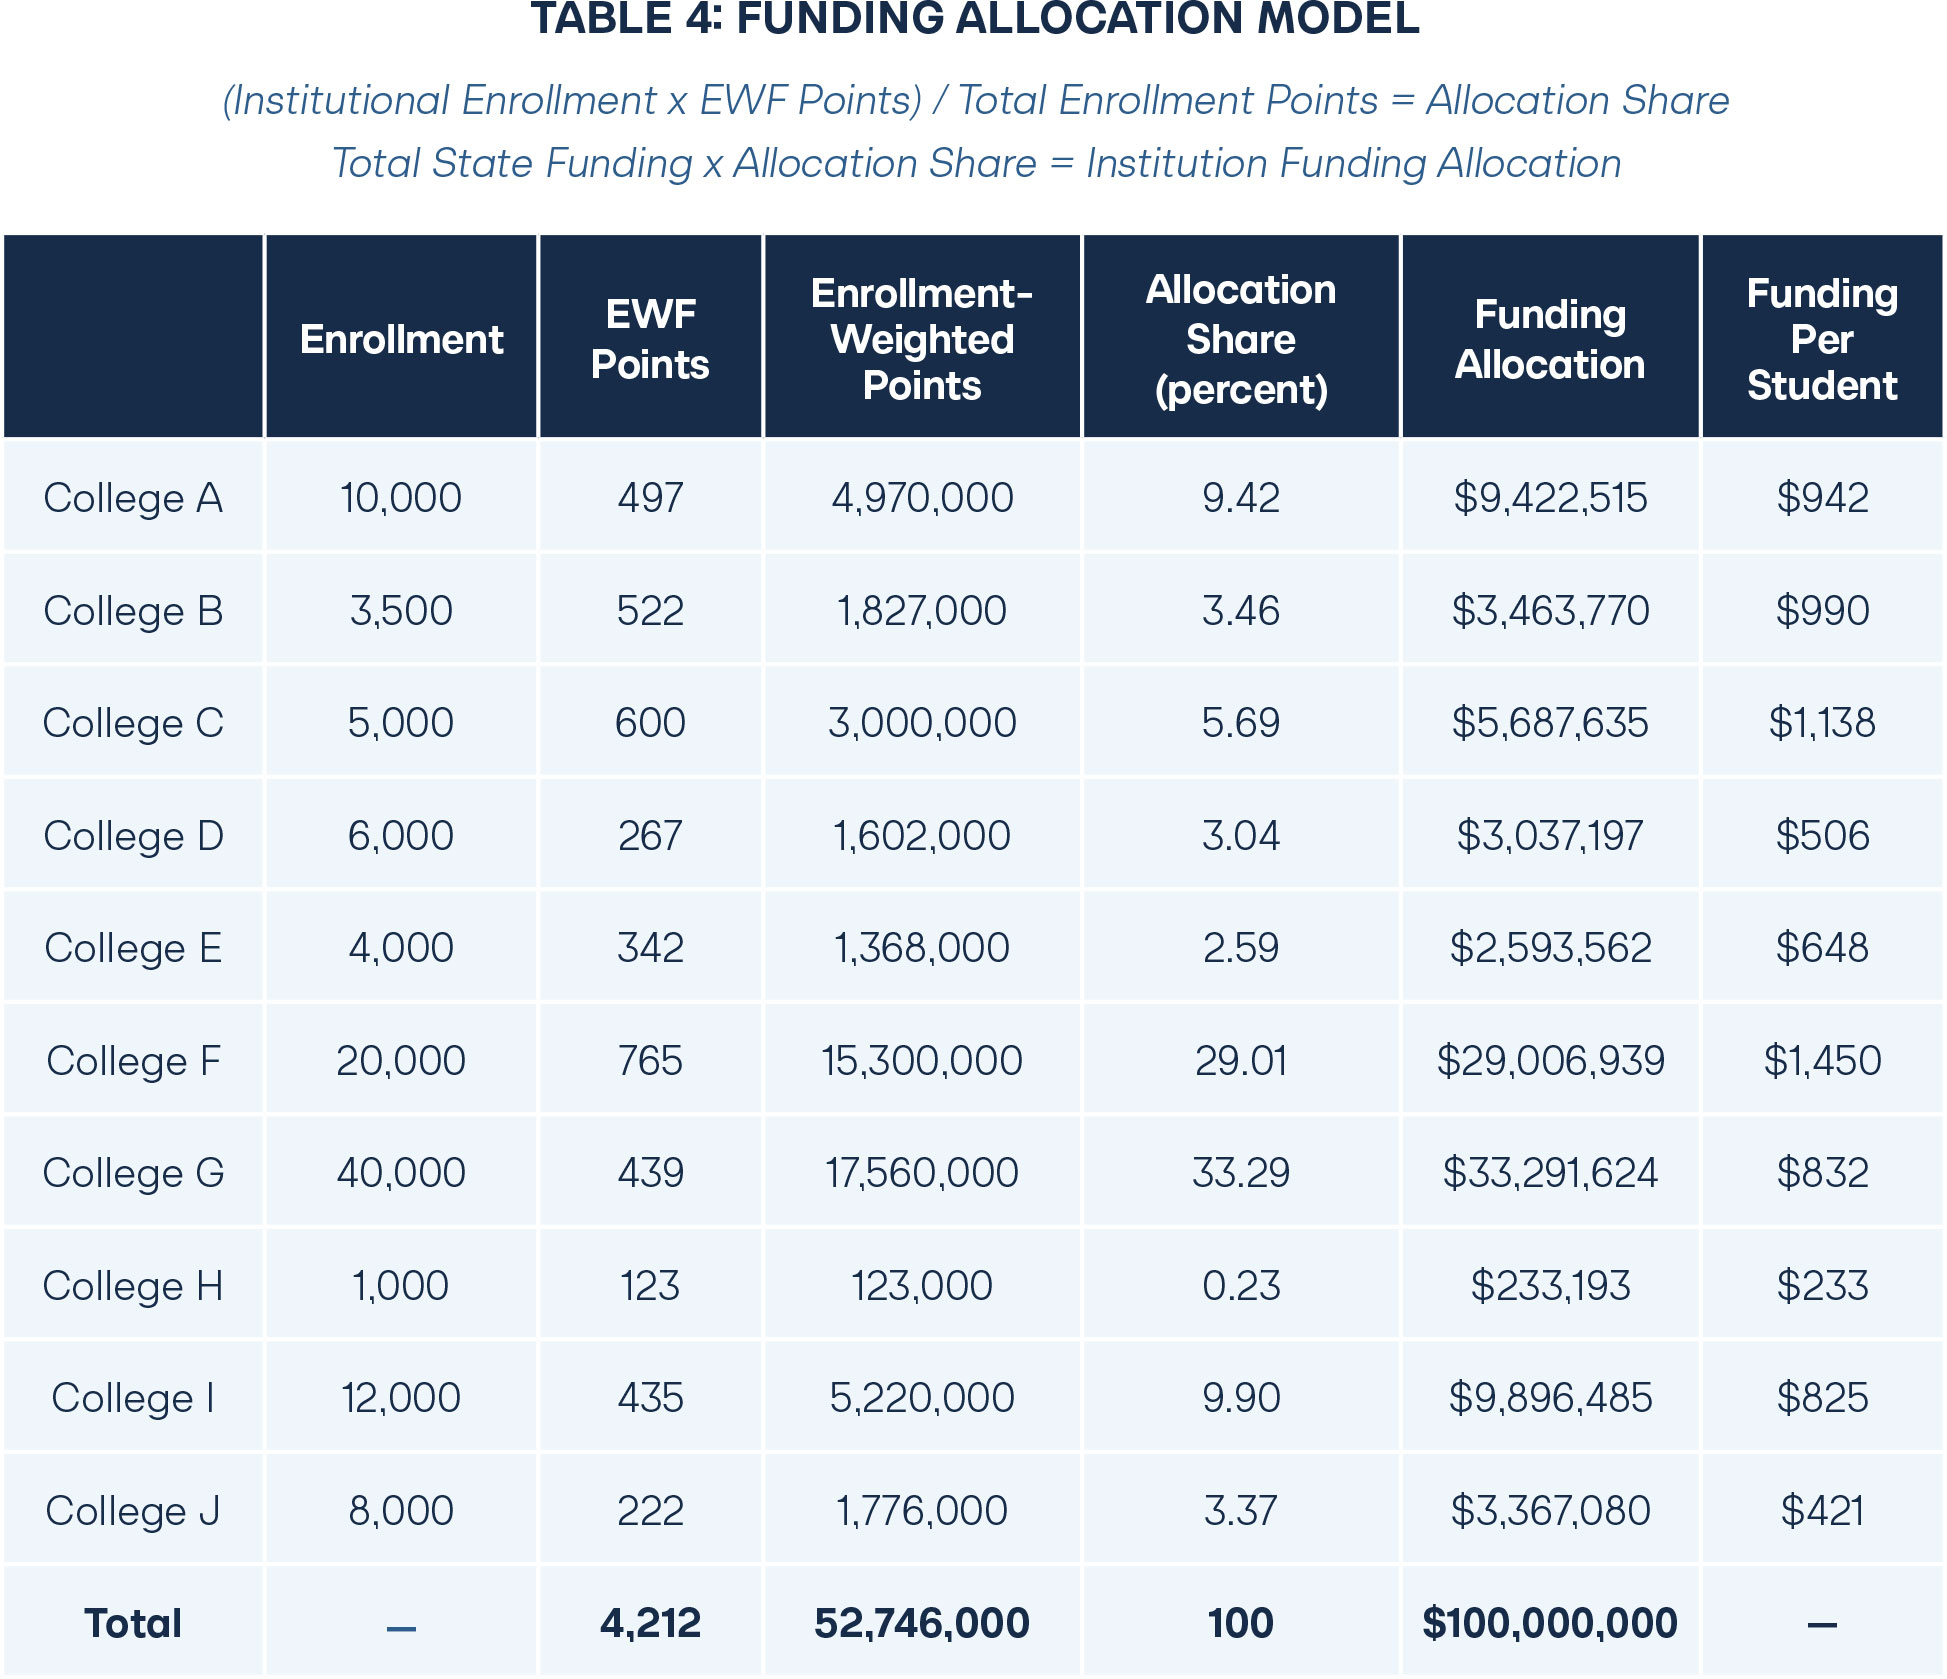
7. Institution’s Funding Allocation
Finally, the institution’s state funding is allocated by multiplying the institution’s share by the total funding amount. In the above formulation, the total higher education funding is $100,000,000. Therefore the College A’s Funding Allocation is:
$100,000,000 x 0.094 = $9,422,515
And College A’s funding per student is:
$9,422,515 / 10,000 = $942/student
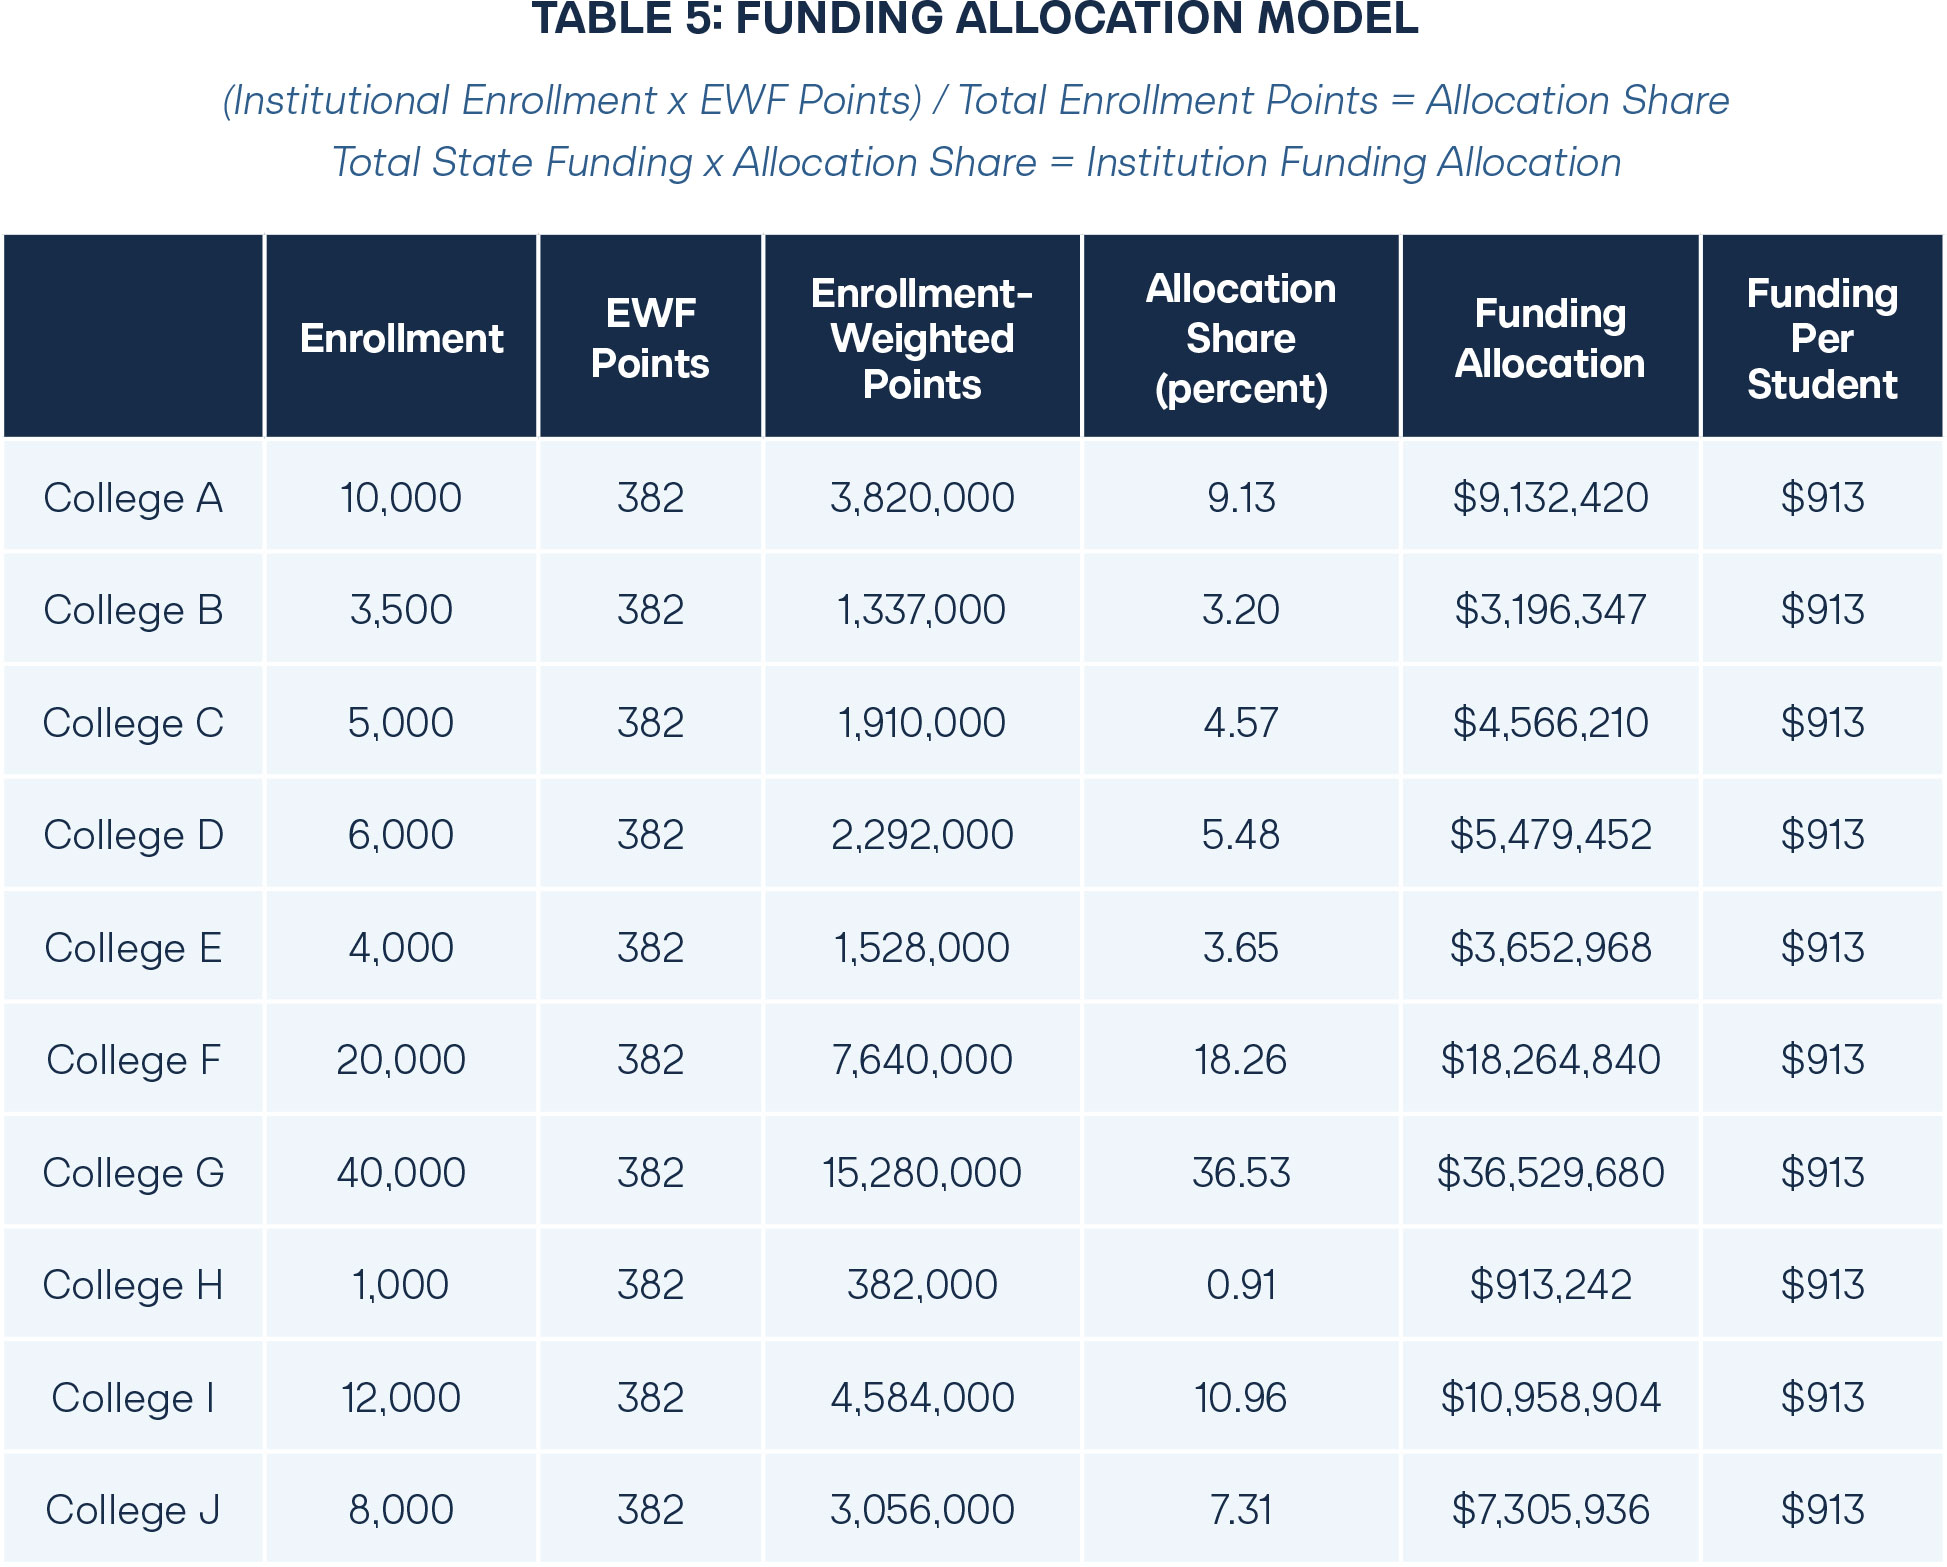
In this formulation, the total allocation to each institution is dependent on the total enrollment as well as the EWF score. However, the per student allocation is entirely dependent on the EWF score. For example, if all institutions had the same EWF score, the per student allocation would be the same for each institution (see Table 5).
Levers of Innovation
States implementing the Earnings-Weighted Funding model will be able to tailor the program to their educational goals and values by:
- Choosing the percentage of their overall budget to be allocated through EWF.
- Deciding how to weight the base and access measures.
Percent of Total Funding
The percentage of the overall state higher education budget allocated through the EWF formula will determine the incentive impact of the program. In current performance-based funding programs, states have allocated from as little as one percent to virtually 100 percent of funding through the formula.41 The more funding allocated through the EWF formula, the greater the incentive for institutions to focus on the desired outcomes.
One concern about allocating funding through the performance formula is that variation in yearly outcomes will create unmanageable uncertainty for postsecondary institutions. However, rather than reducing the percentage allocated through the formula, EWF includes enrollment-weighting to keep funds reasonably proportionate to institution size. In addition, states can further smooth out funding by including past funding in the formula, using a three-year rolling average of institutional metrics, or both to reduce extreme variability.
Weights and Measures
State legislatures will also determine the weight of each measure in the index score. For states that are more concerned with equity, or who have significant differences in educational attainment and earnings for low-income students, a larger weight for Access Measures will increase institutional incentives to recruit and retain disadvantaged students. States that want to have more accountability in their higher education funding can more strongly prioritize earnings.
In the model above, the Access Measures were given equal weight to their corresponding base measures (eg., Six-Year Mean Earnings for low-income students has the same weight as Six-Year Mean Earnings for the student population as a whole). However, it is also possible to increase or decrease the weight of an access measure in proportion to its base measure. There is one caveat to this treatment: in order to ensure that institutions do not have an incentive to minimize low-income student enrollment in order to maximize the earnings outcomes of the low-income student population, low-income student enrollment as a percent of total enrollment must be included as a primary metric.
In addition to adjusting metric weights, earnings data can also be adjusted according to the cost of living in a school’s area. In states with a lot of variation in cost of living, this will help to make earnings ratios more comparable across institutions.
Conclusion
Earnings-Weighted Funding is driven by the idea that higher education should focus on knowledge that helps students to attain future success. This knowledge will take many forms—from soft skills like personal discovery of passions and talents, to hard skills like technical job-specific understanding. EWF incentivizes institutions to encourage students toward higher-paying degrees, aligning student and institutional goals. It encourages students toward in-demand fields in a state’s workforce, likewise, aligning student and institutional goals with broader state goals.
Many performance-based funding formulas choose to reward intermediate milestones such as retention rates, graduation rates, or choice of major, since these are easy to collect and report in a timely manner. We recommend instead that schools use intermediate measures to predict the long-term earnings outcomes of their students as part of their overall improvement strategy, but that these measures not be directly incentivized. Institutions can direct students into higher-earning career paths through many current performance-based funding metrics, such as remediation of lacking skill sets, advising and mentoring, major choice, and career planning and preparation services, but each student body will require different strategies for success. Using intermediate measures unnecessarily restricts institutional strategies.
With Earnings-Weighted Funding, the best ideas in education win. Innovative and creative institutions will be rewarded for helping their students to achieve lasting success. More students will see profitable returns on their educational investments, and institutions that serve their students well will reap the rewards of their innovation. Earnings-Weighted Funding holds institutions accountable for public dollars while increasing educational opportunity for all of America’s students.
Concerns and Potential Objections
Why use 10-year and six-year mean earnings when it takes so long to get the data? Why not use graduation rates instead?
Graduation rates, credit accumulation, and other measures within the institution’s control can be improved without, necessarily, improving the students’ mean earnings. For example, formulas that give equal weight to all types of completion can incentivize institutions to push students toward lower-tier associates degrees and certificates rather than bachelor’s degrees. Where studies showed that performance-based funding brought declines in community college degree completion (Washington, Tennessee, Ohio), this was always accompanied by increases in short-term certificates.42–43 In addition, rewarding completion can lead to weakened academic standards and grade inflation, which work against student job market success. Institutions will often seek to increase more achievable metrics at the expense of other, less achievable ones. Thus, it is important to use earnings metrics so that the school can only increase its funding through increased student preparedness for the workforce.
Is it fair to compare earnings at all institutions to the nationally determined $28,000 high school threshold?
Earnings are a result of where you work, as well as the field in which you work. In order to account for the differences in earnings driven by geographical variations in cost of living, states can adjust the earnings numbers by the regional price indices published by the Bureau of Economic Analysis.44 California comes at the problem from a different angle, choosing to address the baseline threshold to the local cost of living rather than adjusting the earnings by cost of living.45
How will the necessary earnings data be collected?
Until AY2014/15 the Department of Education collected institution-specific earnings data for all students who matriculated, regardless of completion. It was discontinued in favor of program-specific data for graduates only. Since the institutional level data for all students provides the incentive for schools to increase graduation rates as well as engage in other career-enhancing activities, we advocate for the return of the previous earnings data along with the new program-specific data. Alternatively, many states already collect their own student earnings data, even if it is not used for funding calculations, making earnings a viable state-level measure of institutional performance. In Florida, for example, the state Department of Education collects data on the earnings of graduates in the 1st and 5th years after completion of a degree or certificate. They calculate median earnings by award type, by institution, and by program. Only graduates with earnings at or above an annualized minimum wage threshold are counted in the calculation. This data comes from Florida Unemployment Insurance (UI) data in the Florida Department of Revenue and from Florida’s Wage Record Interchange System 2 (WRIS2).46 In Texas, data for the earnings of Texas State Technical College graduates is collected for five years after graduation by the Texas Workforce Commission.47 California is also among the states that collect earnings data. This is conducted by compiling data from the California Community College Management Information Systems (MIS), the California Employment Development Department (EDD), and data reported from The University of California and California State University.48
Why do we need access measures for low-income students? Why should we incentivize low-income student enrollment?
Since disadvantaged backgrounds are often less prepared for postsecondary educational opportunities and tend to have lower earnings after graduation than students of other backgrounds, a focus on long-term earnings has the potential to discourage institutions from recruiting and admitting these students—students for whom education could play the largest transformative role. Including the enrollment of the target population in the funding formula ensures that schools have the incentive to open pathways for students from disadvantaged backgrounds. However, enrollment alone is not sufficient to ensure that higher education will work for these students. In order to ensure that institutions both enroll students with disadvantaged backgrounds and help them succeed, we include the 10-year and 6-year mean earnings for the target population (low-income students in our model). That way, an institution cannot succeed by admitting large numbers of disadvantaged students without also increasing their long-term success.
If this reform takes away significant amounts of funding from some schools before they have time to adapt, won’t this drastically harm the education of current students and the job security of current employees?
In the short term, the Earnings-Weighted Funding formula will suggest drastic changes to some school budgets. These would be unfair since schools haven’t yet had a chance to change their methods. Therefore, we suggest a stop-loss provision for the first three years of implementation, so that during those first three years, no school will lose more than 10% of its operating budget. In the long term, however, schools will have had time to adapt their methods, and any schools who continue to perform poorly will receive budget cuts, meaning that they will be less able to enroll new students and that their per-student tuition will have to rise to continue operating. If students are less financially able to attend poorly-performing schools, and more financially able to attend highly-performing schools, this is a service to those students, the taxpayer, and the state economy.
Will this reform punish liberal arts schools and humanities degrees?
Only if these schools or degrees do worse for their students’ future earnings. However, so long as there remains a market for the skills taught through the arts and humanities, schools will be rewarded for teaching these skills well. States also have the option of excluding schools with special missions (such as religious schools or art schools) from Earnings-Weighted Funding and making separate discretionary allocations to these schools.
What resources will be available for schools who struggle to improve student earnings?
Ultimately, schools will be responsible for the improvement of their own outcomes. However, philanthropic organizations will now have an incentive to support underperforming institutions with enacting policies and practices that increase earnings with the knowledge that, going forward, success will make the school eligible for additional funding to take the place of the initial philanthropic investment. We also recommend, however, that state departments of higher education publish a regular review of state-wide data and best practices found within and outside of the state. In this way, schools who are struggling to improve performance will have resources to which to turn.
Is it fair to award funding on something over which a school has no control?
Postsecondary institutions have control over many policies and practices that impact long-term student earnings. Advising, admission, hiring, credit requirements, general education requirements, and career preparedness resources all impact a students’ ability to succeed on the job market. While much of long-term earnings is determined by students themselves, the environment, opportunities, and resources available to them also have a large impact. It is the school’s job to prepare students for success in the job market.
Will colleges and universities like this reform?
As public funding for higher education continues to shrink across the country, many institutions of higher learning will undoubtedly see this reform as potentially threatening. However, we believe that linking funding of higher education to verifiable objective outcomes that improve the economy and wellbeing of the state will increase support for higher education funding in the future. In addition, the schools that do their job well will be likely to actually benefit from this reform.
Appendix: Performance-Based Funding by State FY20
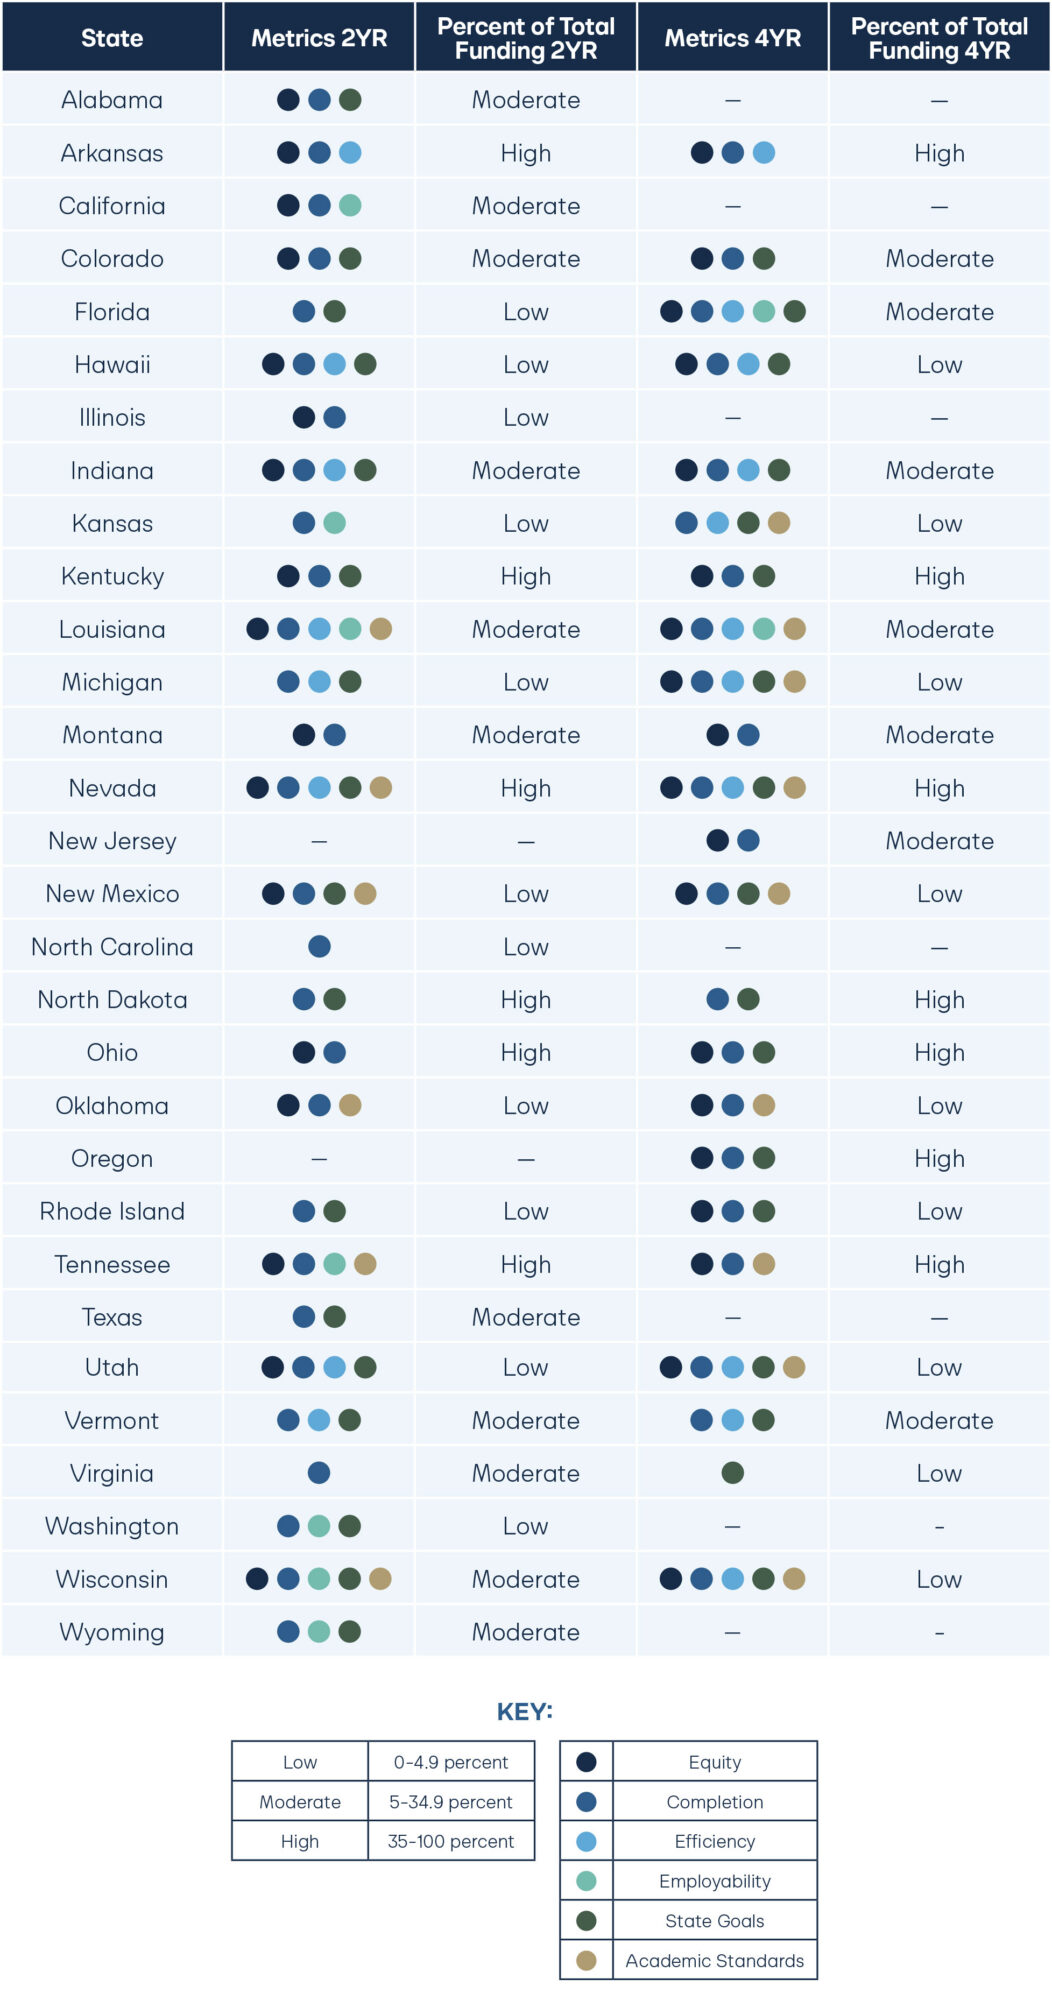
Equity: premiums for disadvantaged student demographics
Completion: transfers, student satisfaction surveys, degrees earned, certificates earned, credit hours earned, graduation rates, retention rates, remedial courses, progress toward degree, dual enrollment
Efficiency: time to degree, degree requirement efficiency, cost to student, student debt on graduation, net institutional revenue
Employability: job placement, entry-level wages, career services, internships and apprenticeships
State Goals: in-state student enrollment, degrees in target fields (STEM, agriculture, etc.)
Academic Standards: research, standardized student assessments, program accreditation
This data is the result of research into the higher education funding structures of each state in the United States that was conducted July and August 2020.
Tennessee’s Current Funding Model49–50
1. Collect Raw Data on Measured Outcomes
The measured outcomes for community colleges include: 12, 24, and 36 credit hour accumulation; dual enrollment; associate’s degrees; long- and short-term certificates; job placement; transfer out with 12 hours accumulated; workforce training; and degrees and certificates per 100 FTE.
The measured outcomes for universities include: 30, 60, and 90 credit hour accumulation; bachelor’s and associate degrees; masters or education degrees; doctoral or law degrees; research and service expenditures; and degrees per 100 FTE.
2. Add Focus Population Premiums
Tennessee currently adds premiums for adults 25 or older, low-income students, and academically underprepared students. If a student falls into one of these categories and has achieved a measured outcome, the school gets an additional 80 percent of a student for that metric. If the student falls into multiple categories and has achieved a measured outcome, the school gets an additional 120 percent of a student for that metric.
3. Scale the Data
The raw data plus the focus population premiums are then scaled using historical average standard deviations.
4. Weighted Outcome Points
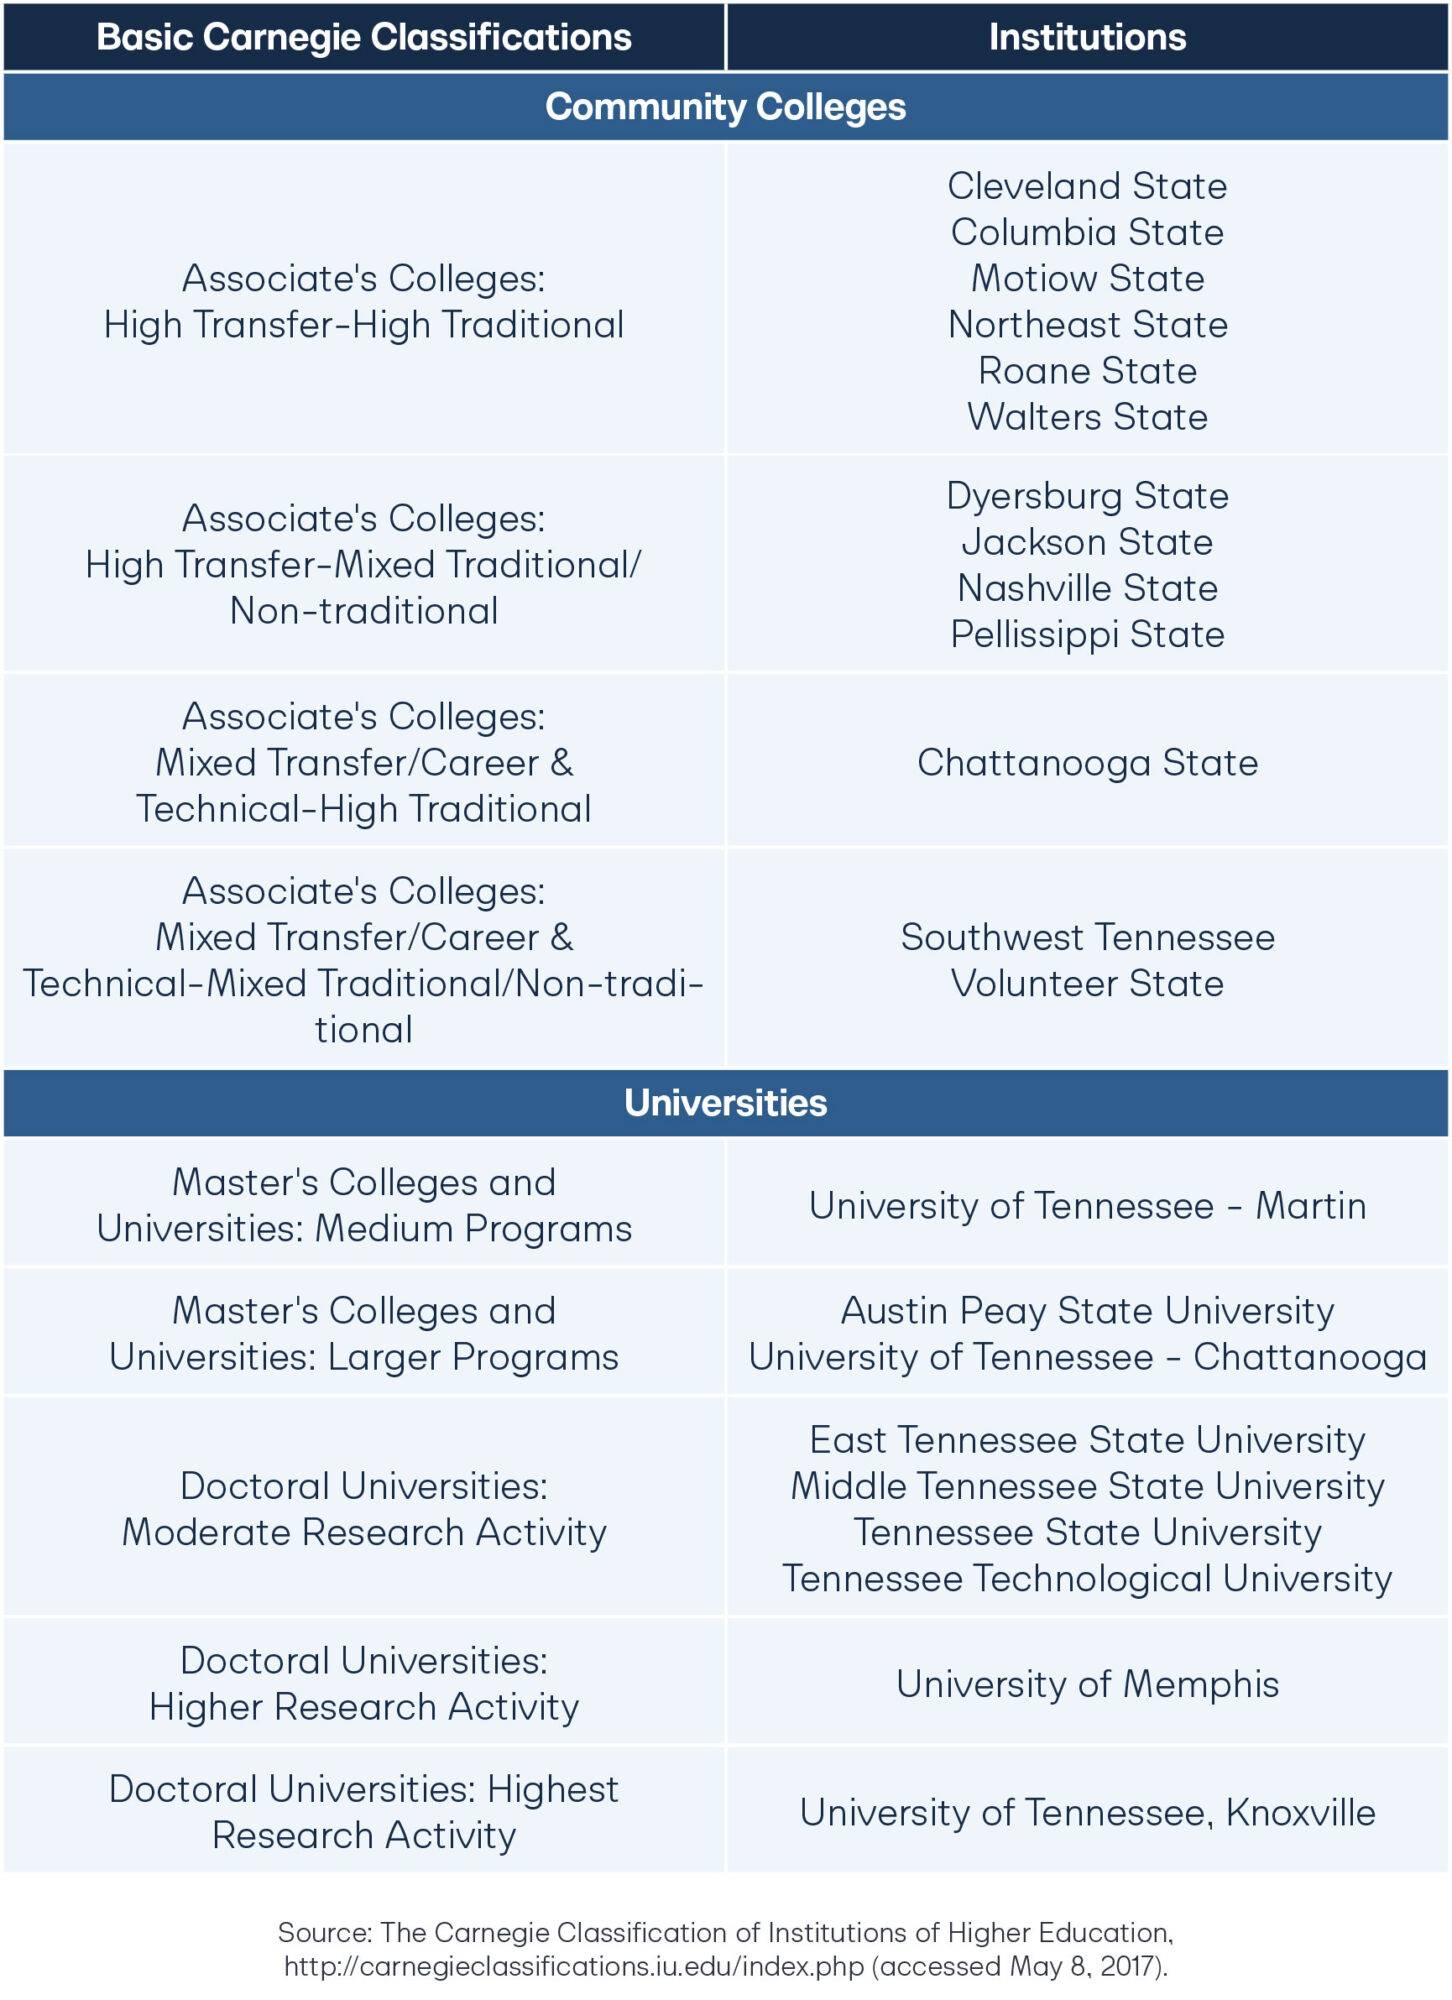
The scaled outcomes are weighted for each institution depending on their institutional mission under the Basic Carnegie Classification as shown in the chart below. The data from this step becomes the “Weighted Outcome Points” in the final point calculation.
Tennessee’s Community Colleges and Universities by Basic Carnegie Classification
5. Fixed Costs Points
The state uses a fixed costs constant to calculate the funding allotted to maintenance and operations, utilities, equipment replacement, and education and general spaces. If a school needs funding for new capital expenses or capital maintenance expenses, this will be additional funding from outside of the formula.
To calculate Fixed Costs Points, the fixed costs constant is multiplied by the total Weighted Outcomes Points from the last step. This is then multiplied by the school’s “fixed costs share,” which is equivalent to the school’s share of fixed costs out of the total fixed costs for the state in the previous year.
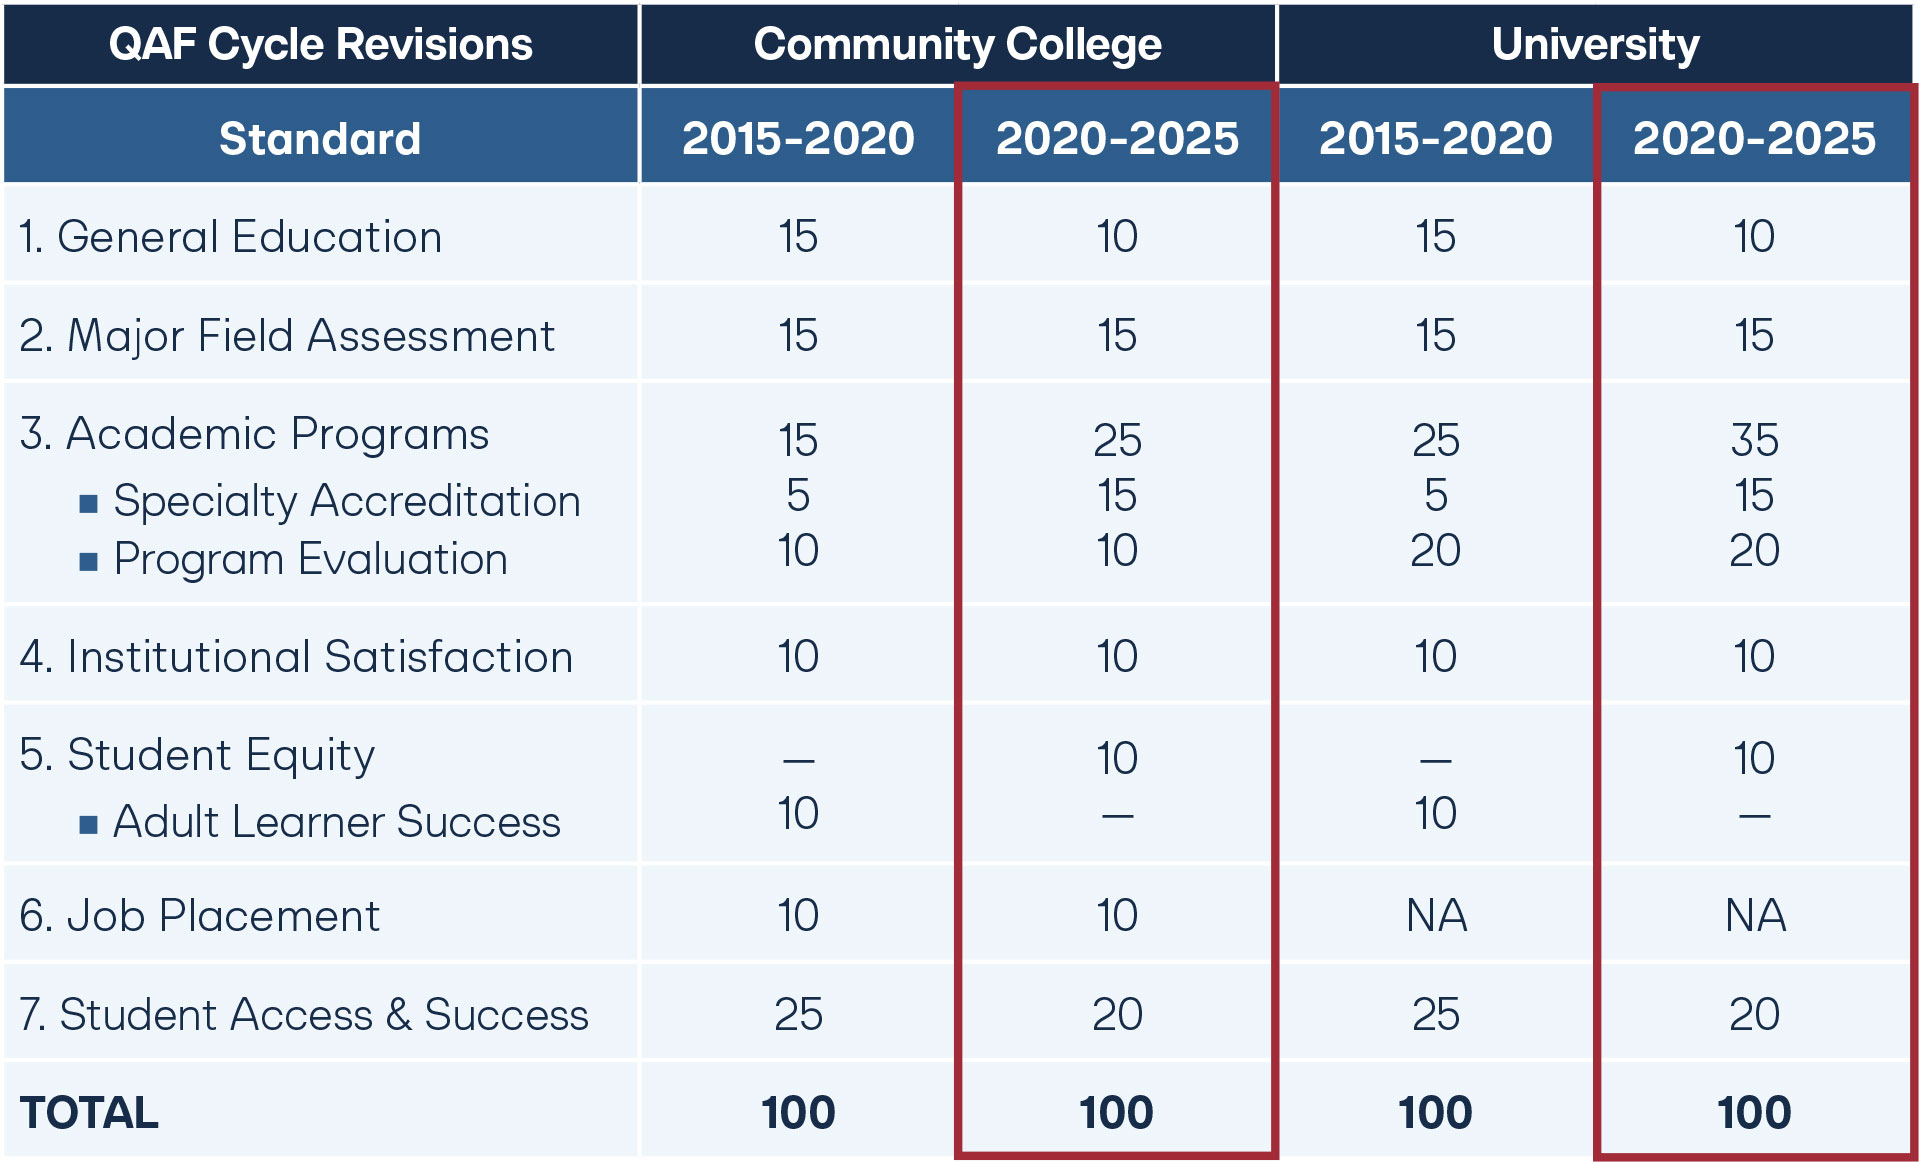
6. Quality Assurance Funding Points
Institutions are assessed on seven standards and assigned performance points on these standards out of a possible 100, as shown below. Many of these overlap with the measured outcomes in step one. They are reassessed every five years.
7. Final Recommendation
A school’s point total is the sum of their Weighted Outcome Points, their Fixed Costs Points, and their Quality Assurance Funding Points.
Then the school’s appropriation share is calculated. The appropriation share is equal to the school’s percent change in points from the previous year (plus one) multiplied by the school’s share of the total points in the state.
This figure is then divided by the percent change in statewide points from the previous year (plus one) to calculate the school’s final allocation share for the current year.
The state then decides how much funding it will allocate to higher education in a given year and each school’s allocation is determined by their final share.
REFERENCES
Bartik, Timothy J. and Hershbein, Brad J.. “Degrees of Poverty: Family Income Background and the College Earnings Premium.” W.E. Upjohn Institute Employment Research Newsletter 23, no. 3 (July 2016). https://research.upjohn.org/cgi/viewcontent.cgi?article=1247&context=empl_research.
Bloomfield, Amber. “Outcomes for Florida’s Public Postsecondary Educational Institutions.” Florida Economic Security Report 2019, Feb. 2020. http://www.fldoe.org/core/fileparse.php/5652/urlt/2019EconomicSecurityReport.pdf.
Bureau of Economic Analysis. “MARPP Regional Price Parities by Metropolitan Statistical Area.” May 2020. https://apps.bea.gov/iTable/drilldown.cfm?reqid=70&stepnum=40&Major_Area=5&State=5&Area=XX&TableId=104&Statistic=1&Year=2017&YearBegin=-1&Year_End=-1&Unit_Of_Measure=Levels&Rank=1&Drill=1&nRange=5.
Bustamante Jaleesa. “College Graduation Statistics.” EducationData.org, June 2019.
https://educationdata.org/number-of-college-graduates/.
California Community Colleges. “Student-Centered Funding Formula FY2019-20 Metric Definitions.” https://www.cccco.edu/-/media/CCCCO-Website/Files/Finance-and-Facilities/Student-Centered-Funding-Formula/A4-scff-201920-metric-definitionsv21222019ADA.pdf?la=en&hash=A8EC2FC76CF233C21591E22259DD2319C10153B8.
Callahan, M. Kate, Meehan, Kasey, et al.. “Implementation and Impact of Outcomes-Based Funding in Indiana.” Research for Action, 2017. https://8rri53pm0cs22jk3vvqna1ub-wpengine.netdna-ssl.com/wpcontent/uploads/2017/07/RFA-OBF-in-Indiana-Full-Brief_updated-July-2017.pdf.
Department of Education. “Technical Documentation: College Scorecard Institution-Level Data.” College Scorecard (March 2020). https://collegescorecard.ed.gov/assets/FullDataDocumentation.pdf.
Department of Education. “Using Federal Data to Measure and Improve the Performance of U.S. Institutions of Higher Education.” College Scorecard (September 2015). https://collegescorecard.ed.gov/assets/UsingFederalDataToMeasureAndImprovePerformance.pdf.
Gillen, Andrew. “The Case for Escape Hatches from Higher Education Accreditation.” Texas Public Policy Foundation, April 2020. https://files.texaspolicy.com/uploads/2020/04/08112552/Gillen-Escape-Hatches-from-Higher-Ed-Accreditation.pdf.
Hillman, Nicholas W., Fryar, Alisa H., and Crespín-Trujillo, Valerie. “Evaluating the Impact of Performance Funding in Ohio and Tennessee.” American Educational Research Journal 55 (1): 144–170. 2018. http://doi.org/10.3102/0002831217732951.
Hillman, Nicholas W., Tandberg, David A., and Fryar, Alisa H.. “Evaluating the Impacts Of ‘New’ Performance Funding in Higher Education.” Educational Evaluation and Policy Analysis 37 (4): 501–19. 2015. http://doi.org/10.3102/0162373714560224.
Jones, Dennis P. “Outcomes-Based Funding: The Wave of Implementation.” Complete College America. National Center for Higher Education Management Systems, (October 2013). https://www.insidehighered.com/sites/default/server_files/files/Outcomes-Based%20Funding%20Report%20(Final).pdf.
Kantrowitz, Mark. “Total Student Loan Debt Outstanding.” SavingforCollege.com, July 2020.
https://www.savingforcollege.com/article/total-student-loan-debt-outstanding.
Laderman, Sophia and Weeden, Dustin. “State Higher Education Finance (SHEF) Report FY19.” State Higher Education Executive Officers Association, 2020. https://shef.sheeo.org/wpcontent/uploads/2020/04/SHEEO_SHEF_FY19_Report.pdf.
Li, Amy Y.. “Lessons Learned: A Case Study of Performance Funding in Higher Education.” Third Way, October 2018. https://www.thirdway.org/report/lessons-learned-a-case-study-of-performance-funding-inhigher-education.
Li, Amy Y. and Kennedy, Alec I.. “Performance Funding Policy Effects on Community College
Outcomes: Are Short-Term Certificates on the Rise?.” Community College Review 46 (1): 3–39. 2018.
http://doi.org/10.1177/0091552117743790.
Osborn, Peter. “Do College Grads Really Earn More Than High School Grads?.” Cornerstone University, Nov. 2016. https://www.cornerstone.edu/blog-post/do-college-grads-really-earn-more-than-high-school-grads/.
Tennessee Higher Education Commission and Tennessee Student Assistance Corporation. “Tennessee Higher Education Fact Book 2019-2020.” https://www.tn.gov/thec/research/fact-book.html.
Tennessee Higher Education Commission and Tennessee Student Assistance Corporation. “Quality Assurance Funding.” July 2020. https://www.tn.gov/content/dam/tn/thec/bureau/aa/academic-programs/qaf/THEC_2020-25%20Quality%20Assurance%20Funding_Guidebook.pdf.
Testa, Joshua. “Funding Tennessee’s Public Colleges and Universities: The Outcomes-Based Funding Formula.” Office of Research and Education Accountability, Tennessee Comptroller of the Treasury. November 2017. https://comptroller.tn.gov/content/dam/cot/orea/advancedsearch/2017/2017_OREA_OutcomesBasedFund.pdf.
Texas State Technical College. “TSTC Formula Funding.” https://www.tstc.edu/about/funding.
The Urban Institute. “Higher Education Expenditures,” 2011-Present. https://www.urban.org/policycenters/cross-center-initiatives/state-and-local-finance-initiative/state-and-local-backgrounders/highereducation-expenditures.
Vetter, Richard and Strehle, Justin. “The Diminishing Returns of a College Degree.” The Wall Street Journal, June 2017. https://www.wsj.com/articles/the-diminishing-returns-of-a-college-degree-1496605241.
Whitmire, Richard. “Alarming Statistics Tell the Story Behind America’s College Completion Crisis: Nearly a Third of All College Students Still Don’t Have a Degree Six Years Later.” The 74 Million, April 2019. https://www.the74million.org/article/alarming-statistics-tell-the-story-behind-americas-college-completioncrisis-nearly-a-third-of-all-college-student-still-dont-have-a-degree-six-years-later/.

Stay Informed
Sign up to receive updates about our fight for policies at the state level that restore liberty through transparency and accountability in American governance.